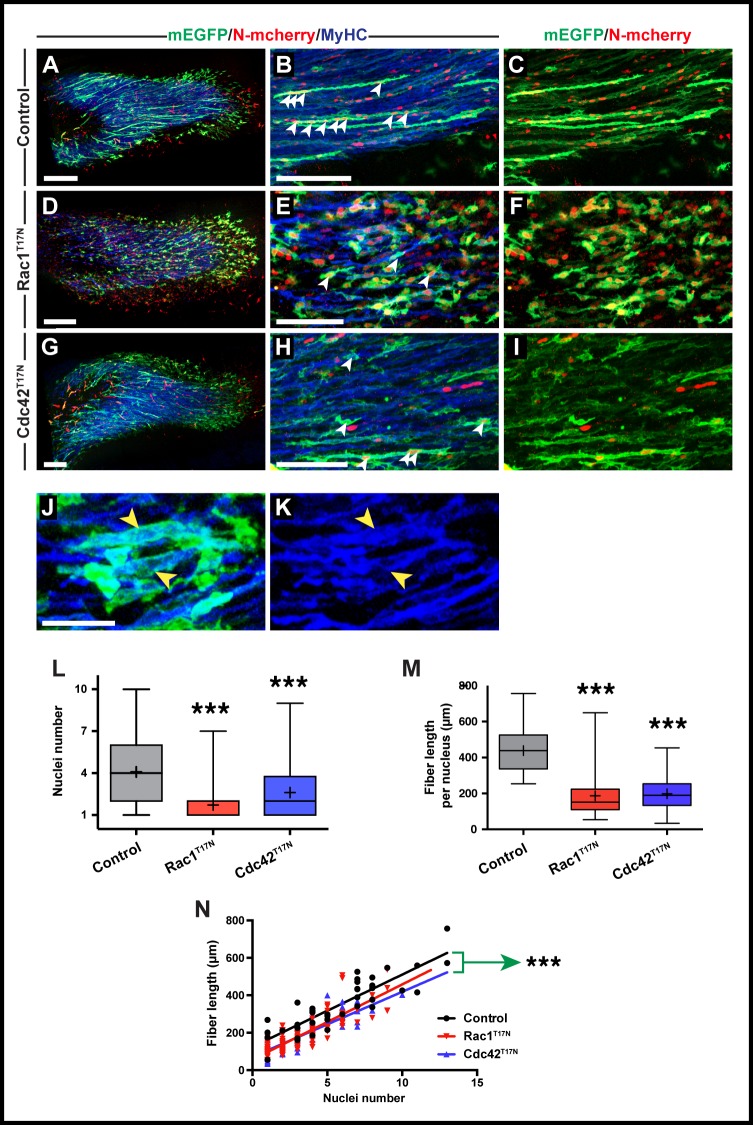
Fig 3. Rac1 and Cdc42 are required in early chicken forelimb fusion.
A-I. Cells from the VLL at forelimb level (somites 16–21) were electroporated at E2.5 and doxycycline-expression of constructs performed from E3.5. The nuclei count per fiber was performed at E5.5. A,D,G. Confocal images of whole forelimb muscle masses. B,C,E,F,H,I. Close up of fibers within forelimb muscle masses. Arrowheads (B,E,H) indicate cell nuclei within selected fibers. J,K. Close-up of E showing that after expression of Rac1T17N, even GFP-positive mono-nucleated fibers (yellow arrowheads in J) express MyHC (yellow arrowheads in K). L. Quantification of nuclei number per fiber at the time points in A-I (see Fig 2 legend). M. Quantification of fiber length compared to nuclei number for all treatments. N. Compiled quantifications of fiber length compared to nuclei number for each treatment. Green arrow indicates significantly different intercept for Rac1T17N and Cdc42T17N compared to control. Control: R2 = 0.757, "Y = 38.59*X + 124.6"; Rac1T17N: R2 = 0.777, "Y = 39.75*X + 57.56"; Cdc42T17N: R2 = 0.747, "Y = 34.73*X + 71.16". All images in A-K are whole-mount confocal stacks of fixed embryos. In all images blue is MyHC, green is EGFP and red is mCherry. *p<0.05; ***p<0.0001. Scale bars: 200μm in A,D,G; 50μm in B,C,E,F,H,I,J,K.

