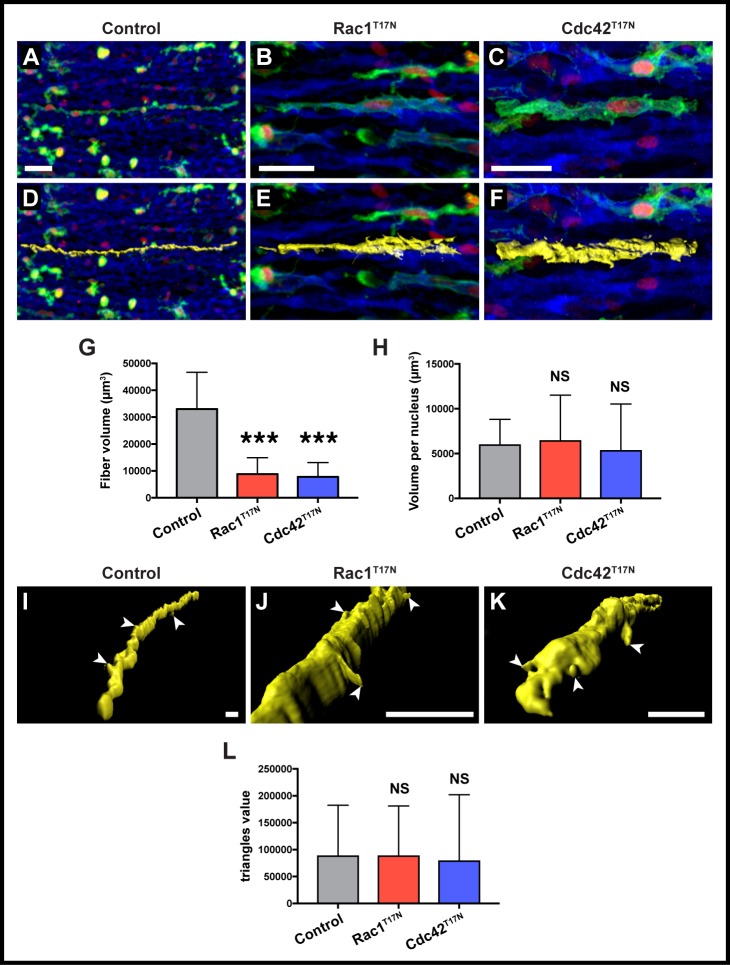
Fig 4. Three-dimensional rendering and analysis of limb muscle fibers.
A-C. Cells from the VLL at forelimb level (somites 16–21) were electroporated at E2.5 and doxycycline-expression of constructs performed at E3.5. Confocal images of selected fibers within forelimb masses. D-F. Three-dimensional renderings of the fibers shown in A-C. Rendering are shown in yellow. G. Quantification of average total volume per fiber in control, Rac1T17N and Cdc42T17N positive fibers. H. Quantification of average volume per nucleus in control, Rac1T17N and Cdc42T17N positive fibers. I-K. Close-up of three-dimensional renderings of the fibers shown in A-C. Renderings are shown in yellow. L. Quantification of average triangles value (i.e. the number of features present in each cell surface) per fiber in control, Rac1T17N and Cdc42T17N positive fibers. A-F are whole-mount confocal stacks of fixed embryos. D-E and I-K show computational volume renderings of whole-mount confocal stacks of fixed embryos. In all images blue is MyHC, green is EGFP and red is mCherry. Arrowheads (I-K) indicate cellular projections on selected fibers. ***: p<0.0001, NS: p>0.05. Error bars indicate standard deviation of the mean. Scale bars: 30μm in A-C; 20μm in I-K.

