
Figure 1.
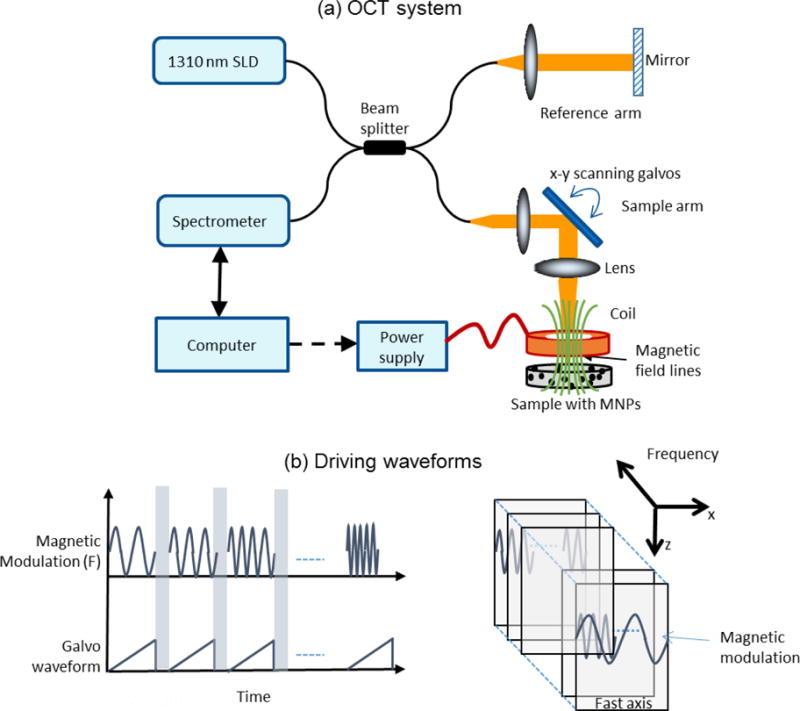
Experimental setup. (a) Magnetomotive optical coherence elastography setup. An electromagnetic coil was placed in the sample arm and (b) Square root of sinusoidal waveforms were used to drive the coil. Cross-sectional images were acquired at different modulation frequencies.