
Figure 2.
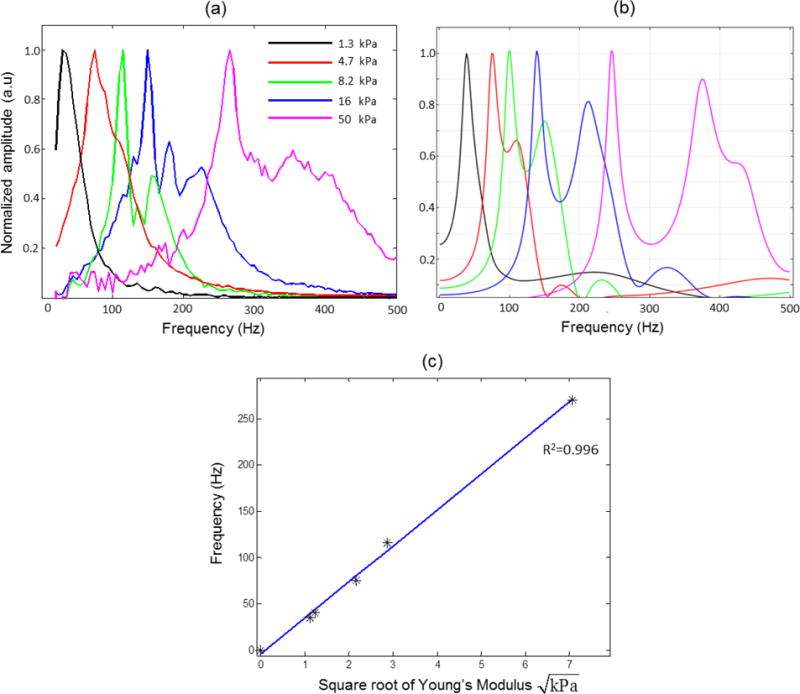
Mechanical resonance frequency in homogeneous phantoms. (a) Experiments. (b) FEM simulations. (c) The measured natural frequency is proportional to the square root of the elastic modulus. The elastic modulus values were measured with a spherical indentation measurement device (model TA.XT Plus Texture Analyzer, Texture Technologies Corp., Algonquin, IL). The blue line represents a linear fit to the data with a R2=0.996.