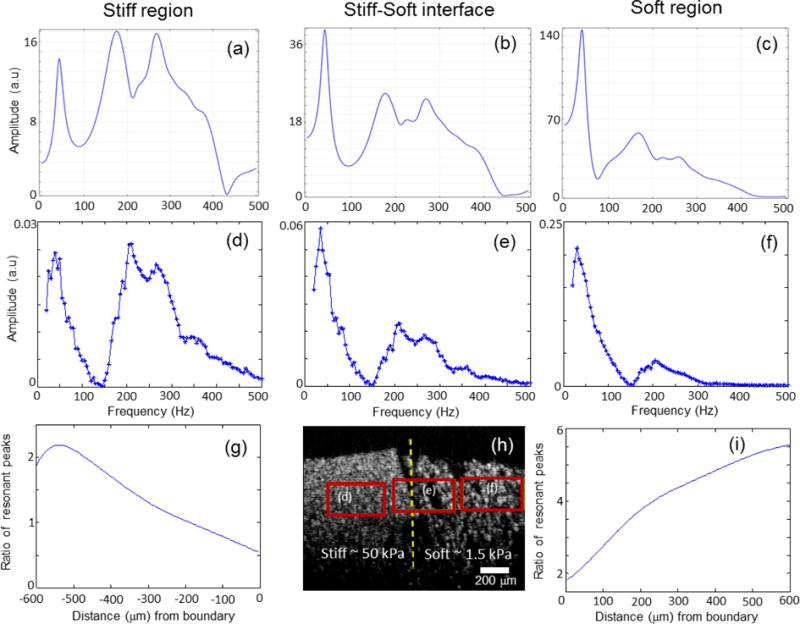
Figure 4.

Spectroscopic magnetomotive data at different frequencies (5 Hz increments). (a) FEM simulations within the (a) stiff region (b) stiff-soft interface (c) soft region. A larger force was applied in the soft region due to a higher concentration of MNPs in this soft region. (d–f) show the experimental signal levels from the boxed regions in the PDMS phantom shown in (h). Note the differences in vertical scales, which were chosen to emphasize the differences in peak heights and relative ratios of the two resonant frequencies. (g) and (i) show that as one moves away from the interface marked by the dotted line in (h), the ratio of the resonant peaks increases, indicating diminishing boundary (interface) effects. The ratio of the resonant peak was defined as the peak amplitude of the soft over the stiff for (g) and the stiff over the soft for (i).
