
Figure 6.
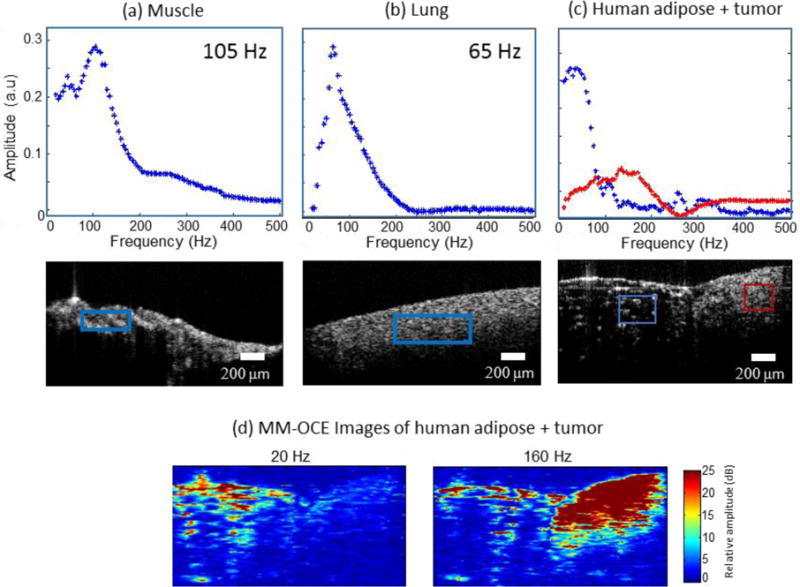
Mechanical resonance frequencies in rat and human tissue samples. (a) Rat muscle and (b) rat lung tissue. (c) Human adipose tissue and tumor. The red and blue boxes indicate the spatial regions from which the displacement amplitudes shown in the plots were calculated. (d) MM-OCE images of human adipose and tumor. At low magnetomotive frequency (20 Hz shown) the adipose is highlighted while at higher frequencies (160 Hz shown) the stiffer tumor region gives a higher magnetomotive signal.