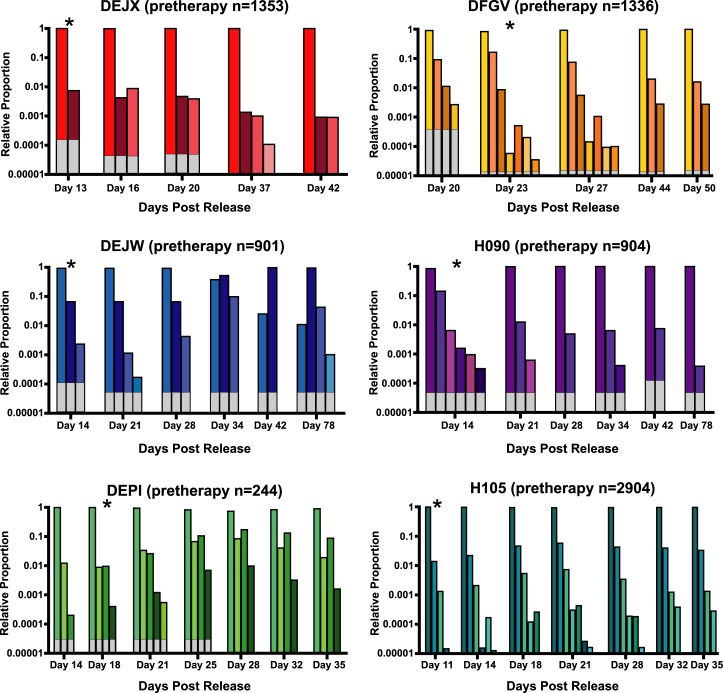
Fig 6. Longitudinal rebound clonotypes.
The relative proportion of the clonotypes in the six animals in study 2 were identified at multiple time points following therapeutic interruption. Each color represents a unique barcode. Although individual barcode numbers are not shown for simplicity, no rebound clonotypes were found in more than one animal. White portions of each column denote the area below the limit of detection for each sample based on template input quantities. Time points denoted with an asterisk indicate the time-point corresponding to the highest viral titers in the exponential growth phase.

