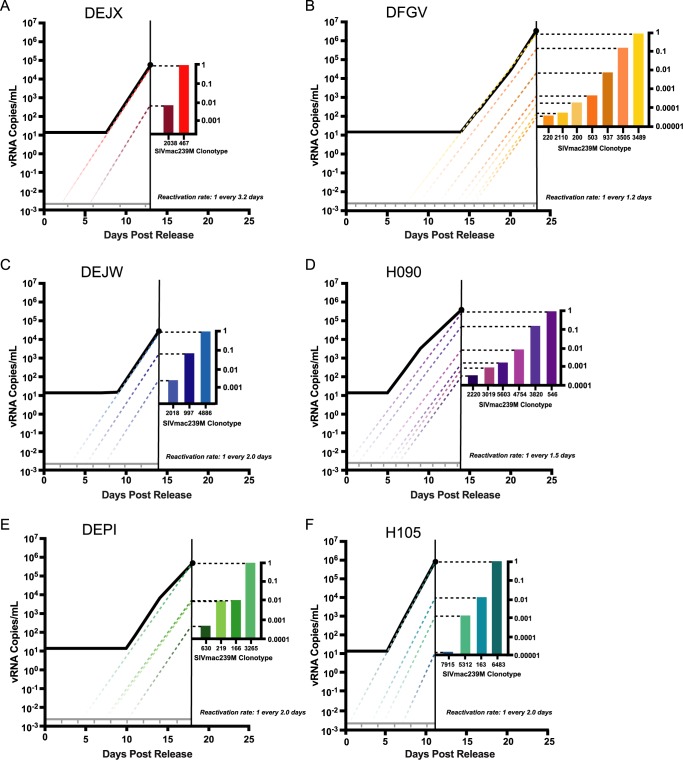
Fig 7. Pairing of relative viral loads and time of reactivation.
Approximate day of reactivation of cells harboring clonotypes was estimated in study 2 animals following interruption of long-duration therapy for animals DEJX (A), DFGV (B), DEJW (C), H090 (D), DEPI (E), and H105 (F). Total viral load at the time point selected is comprised of the relative proportions of clonotypes determined by sequencing analysis. Each individual clonotype’s growth rate was estimated during the maximum exponential phase of the total viral load curve, and the slope of the growth of each clonotype was extended below the limit of detection to estimate the approximate time of reactivation. The grey line represents the plasma concentration of one viral copy in the total plasma, and the tick marks represent the theoretical reactivations based on calculated reactivation rate for each animal.

