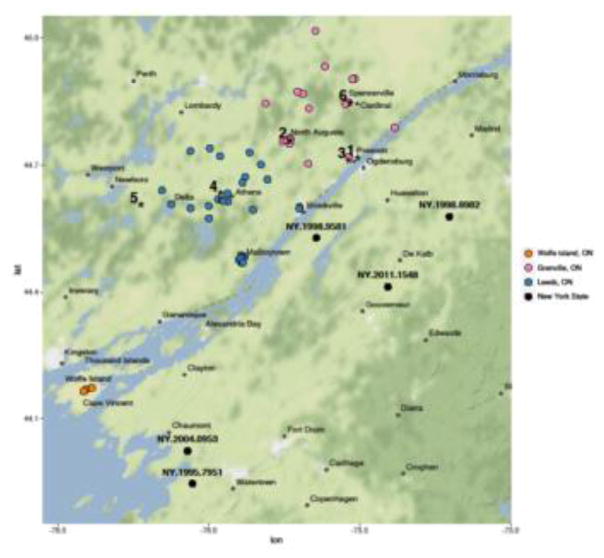
Fig. 3.
A map showing the study area of eastern Ontario and northern New York state. Locations from which sequenced isolates were recovered are shown using the colour coding as detailed in the key except for specimens of special note which are indicated by stars and identified numerically as follows: 1, ON.1999.3306 (index case); 2, ON.1999.3545, (2nd case); 3, ON.2003.1519 (outlier); 4, ON.2003.2760 (outlier); 5, ON.2002.3853 (outlier related); 6, ON.2003.2673, (outlier related).

