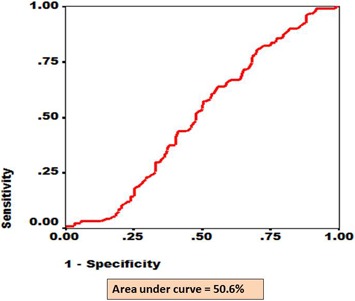
Figure 5.

The ROC for eyes with any stage of DR as diagnosed by RETeval screening and confirmed by digital fundus photography. The x axis shows fraction of 1-specificity while y axis shows fraction of sensitivity. The area under the red line depicts AUC.
