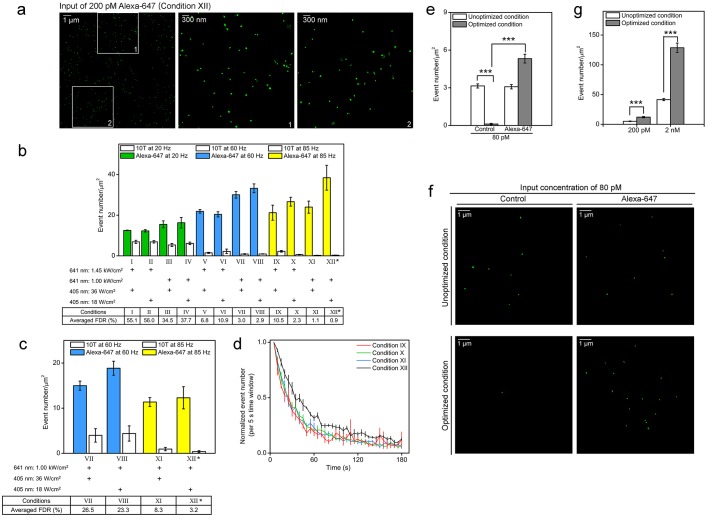
Figure 2. Optimized STORM imaging conditions allow efficient identification of Alexa-647 from the background cellular autofluorescence.
(a,b) Nuclei of fixed SK-N-SH cells were sparsely labeled with Alexa-647-conjugated 10T or 10T controls (input concentration of 200 pM) via non-specific association between oligonucleotide and the nuclear genome at low temperature (4°C). Randomly selected fields were imaged in standard imaging buffer (pH 8.0) using 3D-STORM under the indicated conditions for 180 s. (a) Representative STORM images show switching events (green dots) within a 14 µm x 14 µm nuclear area excited under condition XII (left panel). The middle and right panels are the zoomed views of the two white boxed regions (1 and 2) in the left panel, respectively. The green dots show the fitted position of each event. Each cluster of green dots indicates multiple events collected during the whole imaging process, probably contributed by a single dye. The pseudo-color (green) is used to visualize the dots. (b) Event number per unit area (event number/µm2) is shown as a bar, representing the results from Alexa-647-conjugated 10T (color) or control (white) samples. Power density of the 641 nm or 405 nm laser is shown below each bar. False discovery rate (FDR) calculated as the ratio of event number per µm2 from controls to that from cells treated with Alexa-647-conjugated 10T is shown at the bottom. (*) indicates the condition with lowest FDR value. Representative results are shown from three independent experiments. Error bars, SEM. Control, 10T; Alexa-647, Alexa-647-conjugated 10T. (c) Cell samples were labeled with Alexa-647-conjugated 10T or 10T controls (input concentration of 200 pM) and imaged in a modified buffer containing half concentrations of glucose oxidase and catalase (GLOX) at a relatively low pH of 7.5. Conditions VII-VIII at 60 Hz and XI-XII at 85 Hz were used in the assessments. (*) indicates the condition with lowest FDR value. (d) Event numbers detected per 5 s (Figure 2b) under experimental conditions IX to XII at 85 Hz were calculated and normalized to the first time slot. The plot shows the trend during the entire image series. Error bars, SEM. (e,f) Cell samples were labeled with Alexa-647-conjugated 10T or 10T controls (input concentration of 80 pM) and imaged by optimized or unoptimized STORM (conditions I and XII in Figure 2b, respectively). (e) Event numbers per unit area (event number/µm2) are shown as gray and white bars, representing data collected under optimized and unoptimized conditions, respectively. Representative results are shown from three independent experiments. Error bars, SEM. ***p<0.001; t test. (f) Representative STORM images showing switching events (green dots) in 10 µm x 10 µm nuclear areas excited under optimized (top) or unoptimized (bottom) conditions. The green dots indicate the fitted position of each event. Each cluster of green dots indicates multiple events during the whole imaging process, probably contributed by a single dye. The pseudo-color (green) is used to visualize the dots. (g) Cell samples were labeled with Alexa-647-conjugated 10T or 10T controls at 200 pM or 2 nM input concentration and imaged by optimized (gray) or unoptimized (white) STORM (Conditions I or XII in Figure 2b, respectively). Event numbers per unit area (event number/µm2) from Alexa-647-labeled cells were subtracted from controls (data not shown) and are represented as bars. Representative results are shown from three independent experiments. Error bars, SEM. ***p<0.001; t test.
DOI: http://dx.doi.org/10.7554/eLife.21660.008

