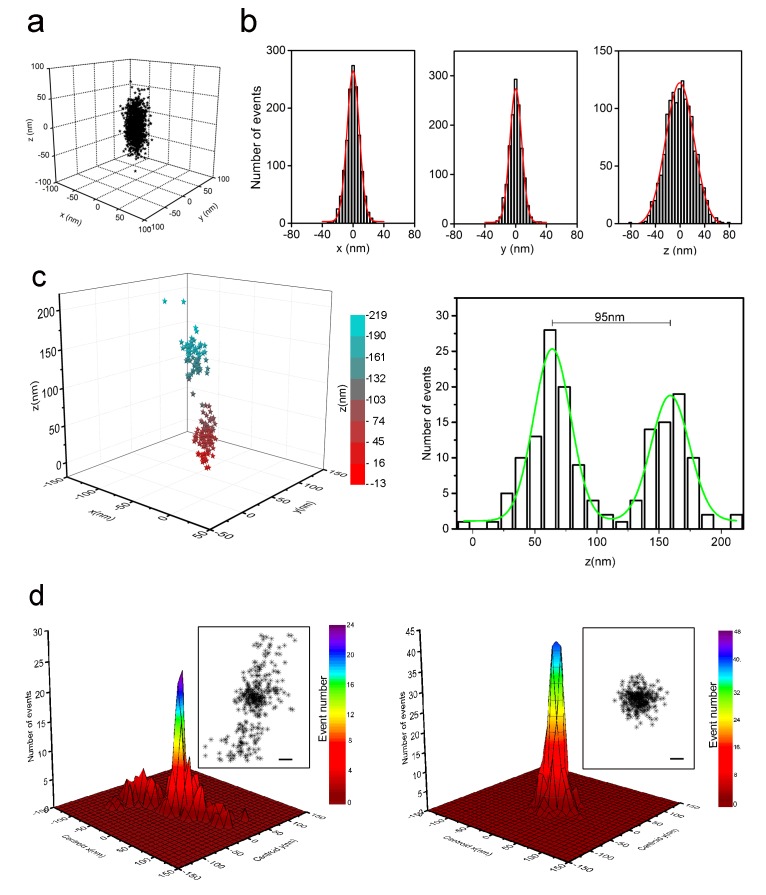
Figure 3. Localization precision of 3D-STORM for sparsely distributed Alexa-647 in cells with refined optical setup.
(a) 3D distribution of localizations from individual Alexa-647 fluorophores in fixed SK-N-SH cells under optimized conditions. Cells were sparsely labeled with Alexa-647 molecules (input concentration of 80–200 pM). Each Alexa-647 fluorophore contributed a cluster of localizations from a series of fluorescent/dark switching cycles. The 1378 localizations from 53 clusters were aligned by their centroid positions to generate the overall 3D presentation of the distribution of localizations. (b) Histograms of the 1378 localizations were fitted to a Gaussian function yielding standard deviations of 9 nm in x, 9 nm in y, and 22 nm in z axes. The corresponding FWHM values were 22 nm in x, 22 nm in y, and 52 nm in z axes. (c) Two neighboring clusters of 160 localizations from cells sparsely labeled with Alexa-647. The 3D distribution of localizations is represented as color-coded z-axis information (left, −13 nm to 219 nm). The histogram shows the z coordinate distribution of these localizations fitted into two Gaussian curves with a separation of 95 nm between the two peaks (green curve, right). (d) Localization precision of the STORM imaging before (left) and after (right) stage drift correction in cells with sparsely distributed Alexa-647, which shows 492 localizations collected from 23 fluorophores that blinked more than 10 times during the entire imaging process. Their lateral positions were realigned so that the average centroid position was at the origin. The main plots show histograms of these centroid positions. The overall distribution of all localizations is shown in the insets. Scale bars are 20 nm. The drift-corrected distribution (right) became significantly narrow compared to the uncorrected distribution (left).

