. 2017 May 2;6:e25366. doi: 10.7554/eLife.25366

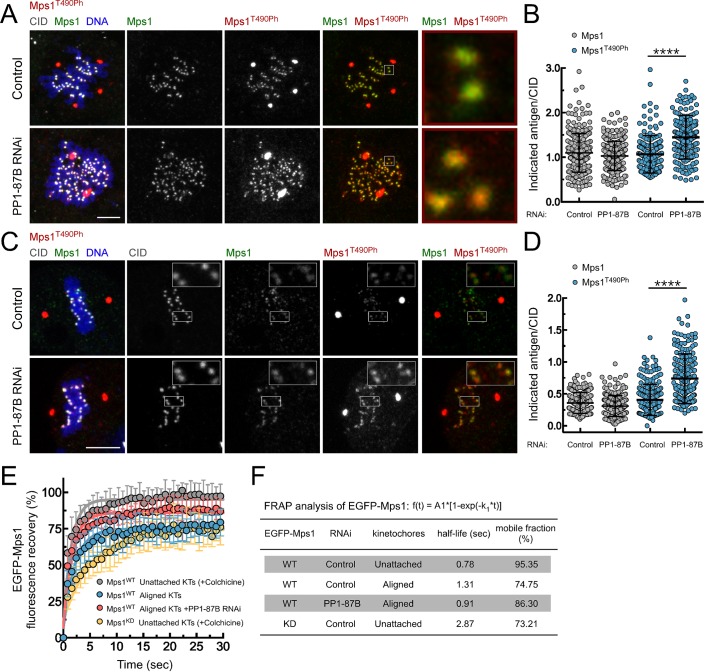
Figure 2. PP1-87B antagonizes Mps1 T-loop autophosphorylation at kinetochores of prometaphase and metaphase cells.

(A,B) Representative immunofluorescence images (A) and corresponding quantifications (B) of Mps1 T490 phosphorylation (Mps1T490Ph) and Mps1 relative levels at prometaphase kinetochores of control and PP1-87B depleted Drosophila S2 cells. The insets display magnifications of the outlined regions. Mps1T490Ph and Mps1 fluorescence intensities were determined relative to CID signal (N ≥ 252 kinetochores from at least 10 cells for each condition). Scale bar: 5 μm. (C,D) Representative immunofluorescence images (C) and corresponding quantifications (D) of Mps1 T490 phosphorylation (Mps1T490Ph) and Mps1 relative levels at metaphase kinetochores of control and PP1-87B depleted S2 cells. The insets display magnifications of the outlined regions. Mps1T490Ph and Mps1 fluorescence intensities were determined relative to CID signal (N ≥ 217 kinetochores from at least 15 cells for each condition). Scale bar: 5 μm. (E,F) FRAP analysis of EGFP-Mps1WT (wild type) and EGFP-Mps1KD (kinase dead) at unattached or metaphase-aligned kinetochores of control and PP1-87B depleted S2 cells. To generate unattached kinetochores, S2 cells were treated with colchicine (30 µM) for 2 hr prior to FRAP experiments (E) Graph displays recovery-time curves of EGFP-Mps1 fluorescence (lines) and their time point means (dots) after bleaching of individual kinetochores in the indicated conditions. (F) Table showing the recovery half-lives and the % of mobile EGFP-Mps1 population obtained after fitting the average fluorescence intensity at each time point to a single-exponential one-phase association curve (N ≥ 9 cells for each condition). Data information: in (B), (D) and (E) data are presented as mean ± SD. Asterisks indicate that differences between mean ranks are statistically significant, ****p<0.0001 (Mann-Whitney U test). Numerical source data for this figure are provided in Figure 2—source data 1.

DOI: http://dx.doi.org/10.7554/eLife.25366.011

Figure 2—source data 1. Numerical data for Figure 2.
elife-25366-fig2-data1.xlsx (112.2KB, xlsx)
DOI: 10.7554/eLife.25366.012

Figure 2.

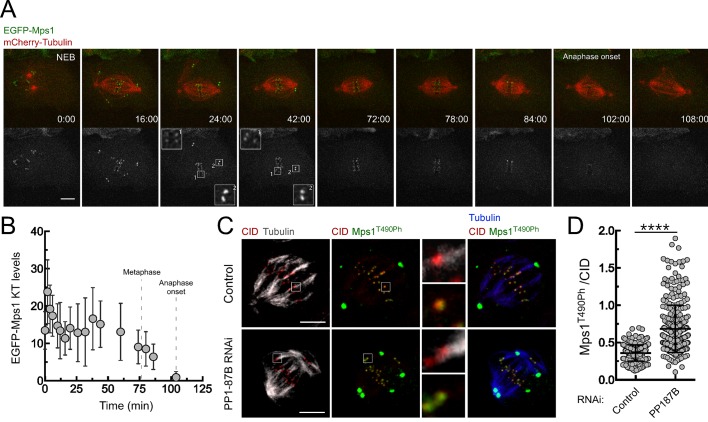
Figure 2—figure supplement 1. PP1-87B antagonizes the T-loop autophosphorylation of Mps1 that remains associated with metaphase kinetochores stably attached to spindle microtubules.

Figure 2—figure supplement 1.

(A) Detailed analysis of mitotic progression of Drosophila S2 cells expressing mCherry-α-Tubulin and EGFP-Mps1. EGFP-Mps1 was expressed under control of Mps1 cis-regulatory region and mitotic progression monitored by time-lapse microscopy. The insets display magnifications of the outlined regions. Time is in min:sec. (B) Quantification of EGFP-Mps1 kinetochores levels from (A). The average fluorescence intensity at kinetochores was corrected for the average EGFP-Mps1 signal in the cytoplasm. Time 0 min corresponds to nuclear envelope breakdown (NEB). Metaphase duration was defined by the length of time between the first still in which all kinetochore pairs were perfectly aligned at the cell equator (Metaphase) and anaphase onset. Dashed lines indicate the time from NEB to metaphase and to anaphase onset. (C,D) Representative immunofluorescence images (C) and corresponding quantifications (D) of Mps1 T490 phosphorylation (Mps1T490Ph) levels at metaphase kinetochores attached to cold-resistant microtubules bundles of control and PP1-87B depleted Drosophila S2 cells. The insets display magnifications of the outlined regions. Mps1T490Ph and Mps1 fluorescence intensities were determined relative to CID signal (N ≥ 270 kinetochores from at least 12 cells for each condition). Scale bar: 5 μm. Data information: in (B) and (D) data are presented as mean ± SD. Asterisks indicate that differences between mean ranks are statistically significant, ****p<0.0001 (Mann-Whitney U test).
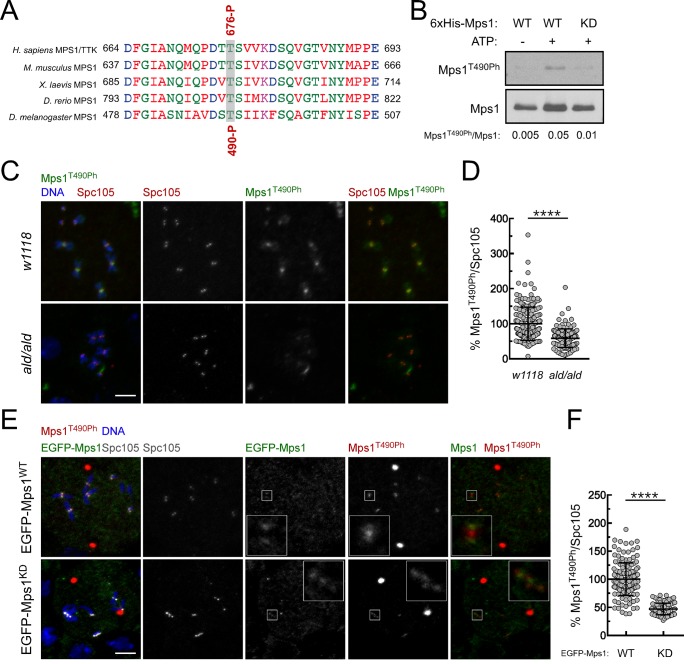
Figure 2—figure supplement 2. Validation of a phospho-specific antibody against Drosophila Mps1 activating T-loop autophosphorylation.

Figure 2—figure supplement 2.

(A) Conservation among Mps1 T-loop residues. Clustal W alignments of T-loop residues of indicated Mps1 orthologues. The conserved Mps1 activating autophosphorylation threonine is highlighted in grey shading. The red numbers note specific residues for human Mps1/TTK (Thr676) and Drosophila Mps1 (Thr490), and P indicates phosphorylation. (B) In vitro autophosphorylation of Drosophila Mps1 detected by western blotting. Recombinant wild type (WT) and kinase dead (KD) versions of recombinant Drosophila Mps1 were incubated with ATP for 30 min and phosphorylation of T490 (Mps1T490Ph) probed with a phospho-specific antibody. The chemiluminescence signal intensity of Mps1T490Ph was determined relative to the signal of total Mps1. (C,D) Representative immunofluorescence images (C) and corresponding quantifications (D) of Mps1 T490 phosphorylation (Mps1T490Ph) at prometaphase kinetochores of third instar larval neuroblasts from w1118 and aldG4422 homozygous (ald/ald). Mps1T490Ph fluorescence intensities were determined relative to Spc105 signal and the mean values for control w1118 neuroblasts were set to 100% (N ≥ 135 kinetochores from at least 12 neuroblasts for each condition from two independent experiments). Scale bar: 5 μm. (E,F) Representative immunofluorescence images (E) and corresponding quantifications (F) of Mps1 T490 phosphorylation (Mps1T490Ph) at prometaphase kinetochores of third instar larval neuroblasts from aldG4422 homozygous expressing EGFP-Mps1WT (wild type) or EGFP-Mps1KD (kinase dead) under control of Mps1 cis-regulatory elements. The insets display magnifications of the outlined regions. Mps1T490Ph fluorescence intensities were determined relative to Spc105 signal and the mean values for neuroblasts expressing EGFP-Mps1WT were set to 100% (N ≥ 87 kinetochores from at least 10 neuroblasts for each condition from two independent experiments). Scale bar: 5 μm. Data information: in (D) and (F) data are presented as mean ± SD. Asterisks indicate that differences between mean ranks are statistically significant, ****p<0.0001 (Mann-Whitney U test).
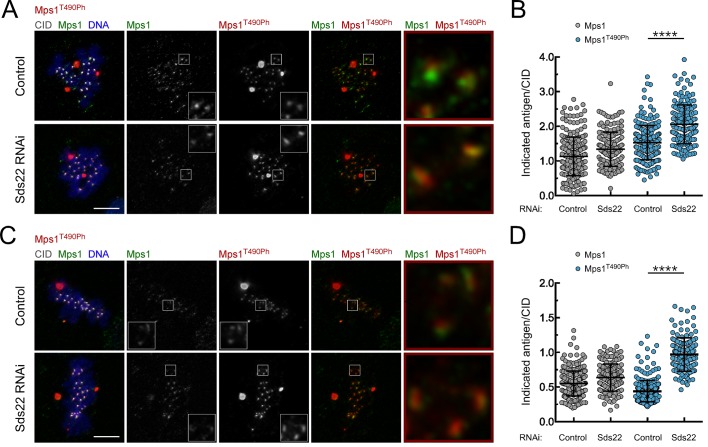
Figure 2—figure supplement 3. Depletion of Sds22 affects Mps1 T-loop autophosphorylation.

Figure 2—figure supplement 3.

(A,B) Representative immunofluorescence images (A) and corresponding quantifications (B) of Mps1 T490 phosphorylation (Mps1T490Ph) and Mps1 relative levels at prometaphase kinetochores of control and Sds22 depleted S2 cells. The insets display magnifications of the outlined regions. Mps1T490Ph and Mps1 fluorescence intensities were determined relative to CID signal (N ≥ 177 kinetochores from at least 8 cells for each condition). Scale bar: 5 μm. (C,D) Representative immunofluorescence images (C) and corresponding quantifications (D) of Mps1 T490 phosphorylation (Mps1T490Ph) and Mps1 relative levels at metaphase kinetochores of control and Sds22 depleted S2 cells. The insets display magnifications of the outlined regions. Mps1T490Ph and Mps1 fluorescence intensities were determined relative to CID signal (N ≥ 186 kinetochores from at least 8 cells for each condition). Scale bar: 5 μm. Data information: in (B) and (D) data are presented as mean ± SD. Asterisks indicate that differences between mean ranks are statistically significant, ****p<0.0001 (Mann-Whitney U test).