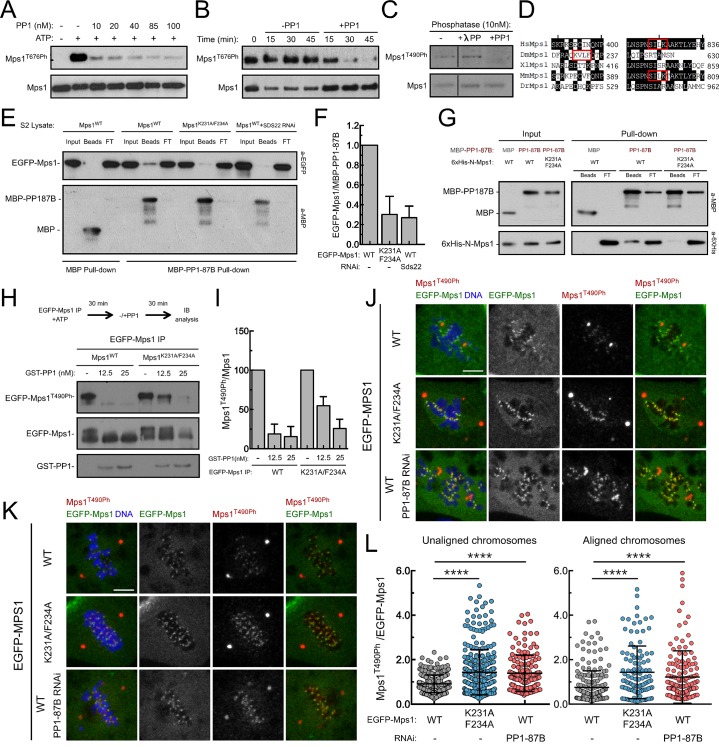
Figure 3. PP1-87B/PP1-γ dephosphorylates Mps1 T-loop in vitro and in vivo.
(A,B) Western blot analysis of Mps1/TTK T676 autophosphorylation. Recombinant human Mps1 was incubated during 30 min with increasing concentrations of recombinant human PP1-γ (A) or PP1-γ (42.7 nM) was added to previously active Mps1 and phosphorylation of Mps1 T676 (Mps1T676Ph) monitored over time (B). (C) Western blot analysis of Drosophila Mps1 T490 autophosphorylation. Recombinant Drosophila Mps1 was incubated during 30 min with 10 nM of recombinant human PP1-γ or λ-PP and phosphorylation of Mps1 T490 (Mps1T490Ph) monitored. (D) Clustal W alignments of amino acid residues of indicated Mps1 orthologues. Red boxes highlight putative PP1-docking motifs identified in silico by the Eukaryotic Linear Motif (ELM) resource. (E) MBP-PP1-87B pull-downs from total cell lysates of S2 cells expressing EGFP-Mps1WT or EGFP-Mps1K231A/F234A or EGFP-Mps1WT upon depletion of Sds22. Immobilized MBP was used as negative control. Input, beads and flow-through (FT) were probed by western blotting for the indicated proteins. (F) Quantification of Mps1 binding to PP1-87B from the pull-downs in (E). The chemiluminescence signal intensity of EGFP-Mps1 was determined relative to the signal of MBP-PP1-87B beads. The graph represents the quantification of relative levels of EGFP-Mps1 in MBP-PP1-87B pull-downs from at least two independent experiments. The values obtained for EGFP-Mps1WT from control cells were set to 1. (G) MBP-87B pull-downs of purified recombinant Mps1 N-terminus region (104–330 amino acids) harboring the wild-type (6xHis-N-Mps1WT) or mutated PP1-docking motif (6xHis-N-Mps1K231A/F234A). Immobilized MBP was used as negative control. Input, beads and flow-through (FT) were probed by western blotting for the indicated proteins. (H) Western blot analysis of EGFP-Mps1WT and EGFP-Mps1K231A/F234A T-loop dephosphorylation by PP1-γ. EGFP-Mps1WT and EGFP-Mps1K231A/F234A were immunoprecipitated from mitotic S2 lysates and incubated with ATP for 30 min to allow Mps1 T-loop autophosphorylation. Increasing concentrations of recombinant GST-PP1-γ were subsequently added to the reaction mixture and Mps1 T490 phosphorylation (Mps1T490Ph) assessed after 30 min. Immunoprecipitates were probed by immunoblotting (IB) for the indicated proteins. (I) Quantification of Mps1T490Ph levels from the dephosphorylation assay in (H). The chemiluminescence signal intensity of Mps1T490Ph was determined relative to the corresponding signal of EGFP-Mps1 immunoprecipitates. The values obtained for each control reaction were set to 100%. The graph represents the quantification of Mps1T490Ph relative levels from two independent experiments. (J–L) Representative immunofluorescence images (J,K) and corresponding quantifications (L) of Mps1 T490 phosphorylation (Mps1T490Ph) at kinetochores of unaligned (J) and aligned (K) chromosomes from S2 cells expressing EGFP-Mps1WT or EGFP-Mps1K231A/F234A and from PP1-87B depleted S2 cells expressing EGFP-Mps1WT. EGFP-Mps1 transgenes were expressed under the control of Mps1 cis-regulatory region (Althoff et al., 2012). Mps1T490Ph fluorescence intensities were determined relative to EGFP-Mps1 signal (N ≥ 150 unaligned kinetochores from at least 8 cells for each condition and N ≥ 111 aligned kinetochores from at least 7 cells for each condition). Scale bar: 5 μm. Data information: in (F), (I) and (L) data are presented as mean ± SD. Asterisks indicate that differences between mean ranks are statistically significant, ****p<0.0001 (Kruskal-Wallis, Dunn’s multiple comparison test). Numerical source data for this figure are provided in Figure 3—source data 1.
DOI: http://dx.doi.org/10.7554/eLife.25366.017


