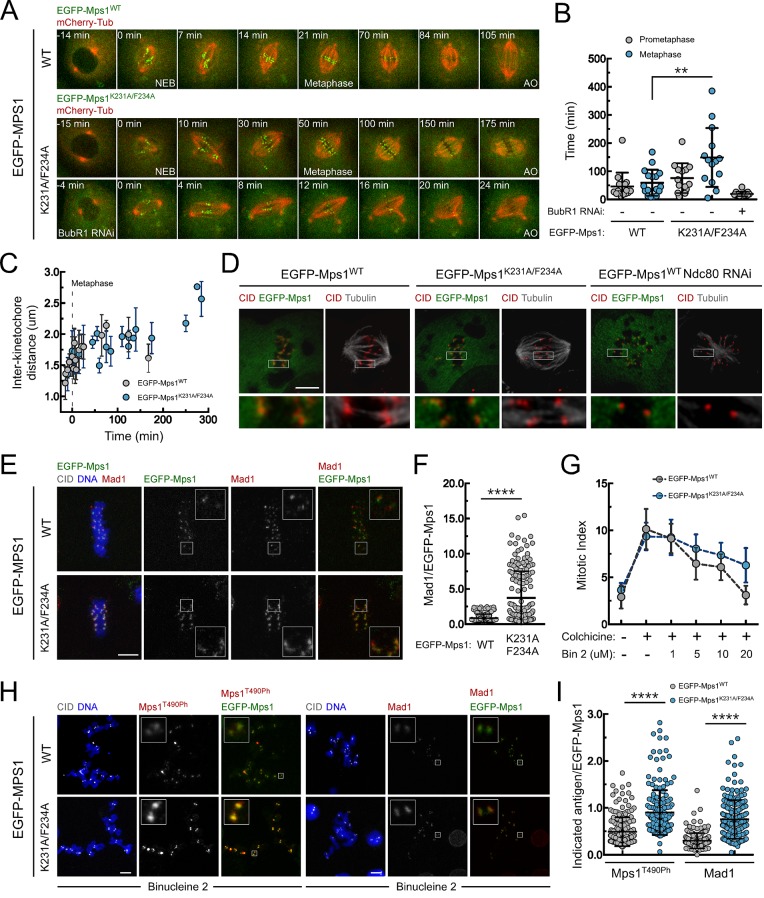
Figure 4. PP1-87B-mediated dephosphorylation of Mps1 T-loop renders the kinase inactive and is required for timely SAC silencing.
(A,B) Mitotic progression (A) and prometaphase and metaphase duration (B) of S2 cells expressing mCherry-α-Tubulin and EGFP-Mps1WT, EGFP-Mps1K231A/F234A or EGFP-Mps1K231A/F234A in a BubR1-depleted background. EGFP-Mps1 transgenes were expressed under control of Mps1 cis-regulatory region and mitotic progression monitored by time-lapse microscopy. The metaphase duration was defined by the length of time measured between the first still in which all kinetochore pairs were perfectly aligned at the metaphase plate (Metaphase) and anaphase onset (AO) (N ≥ 14 cells for each condition, from at least two independent experiments). (C) Quantification of inter-kinetochore distances throughout mitosis in S2 cells expressing EGFP-Mps1WT and EGFP-Mps1K231A/F234A. Inter-kinetochore distances were measured as the distance between centroids of identified EGFP-Mps1 pairs at selected prometaphase and metaphase time frames. Time 0 min corresponds to the first metaphase frame. (D) Representative immunofluorescence images of cold-stable kinetochore fibers in S2 cells expressing EGFP-Mps1WT, EGFP-Mps1K231A/F234A or EGFP-Mps1WT upon Ndc80 depletion. CID immunolocalization was used as kinetochore reference. The insets display magnifications of the outlined regions. Scale bar: 5 μm. (E,F) Representative immunofluorescence images (E) and corresponding quantifications (F) of Mad1 levels at metaphase kinetochores of S2 cells expressing EGFP-Mps1WT or EGFP-Mps1K231A/F234A. Mad1 fluorescence intensities were determined relative to EGFP-Mps1 signal (N ≥ 162 kinetochores from at least 10 cells for each condition). Scale bar: 5 μm. (G–I) Mitotic index (G), representative immunofluorescence images (H) and quantification of Mps1T490Ph and Mad1 levels at unattached kinetochores (I) of colchicine treated S2 cells expressing EGFP-Mps1WT or EGFP-Mps1K231A/F234A in the presence of Aurora B inhibitor, binucleine 2 (Bin2) for 2 hr. Mitotic index in (G) was determined through p-H3 staining of cultured cells incubated in the absence or presence of colchicine (30 µM) for 12 hr. Increasing concentrations of Bin2 were added to cultures 10 hr after colchicine and mitotic index determined 2 hr later. In (H and I) Mps1T490Ph and Mad1 fluorescence intensities were determined relative to EGFP-Mps1 signal in cells treated with Bin2 (20 µM) and colchicine as in (G). Proteasome inhibitor MG132 (20 µM) was added to cultured cells 1 hr prior to Bin2 incubation to prevent mitotic exit (N ≥ 185 kinetochores from at least 9 cells for each condition). Scale bar: 5 μm. Data information: in (B), (C), (F), (G) and (I) data are presented as mean ± SD. Asterisks indicate that differences between mean ranks are statistically significant, **p<0.05, ****p<0.0001 (Mann-Whitney U test). Numerical source data for this figure are provided in Figure 4—source data 1.
DOI: http://dx.doi.org/10.7554/eLife.25366.022


