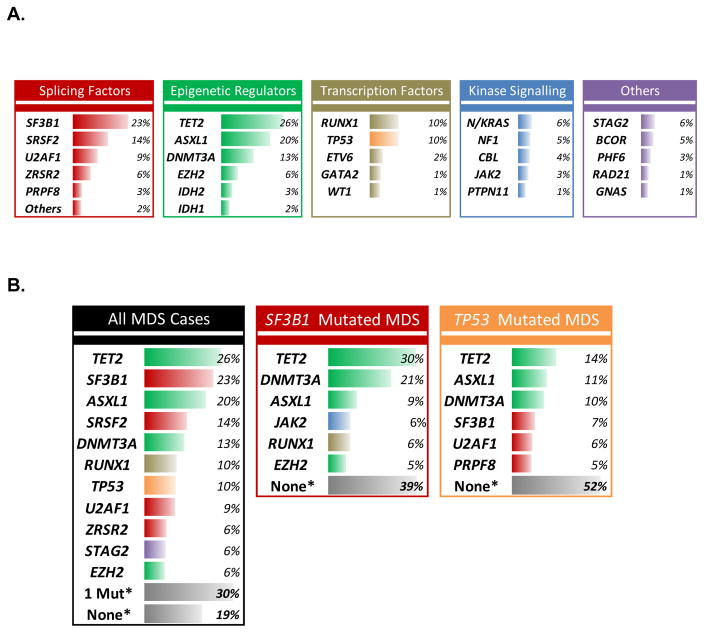
Figure 1. Somatic mutation frequencies by class and mutation group.
A) Frequency of gene mutations organized by functional groups in all cases of MDS. B) Comparison of mutation rates in all MDS cases vs. those with either SF3B1 mutation or TP53 mutation. * - This refers to the percentage of patients with one (1 Mut) or no (None) mutation of the 17 most frequently mutated MDS genes – mutations in more rarely mutated genes may still be present in these cases.

