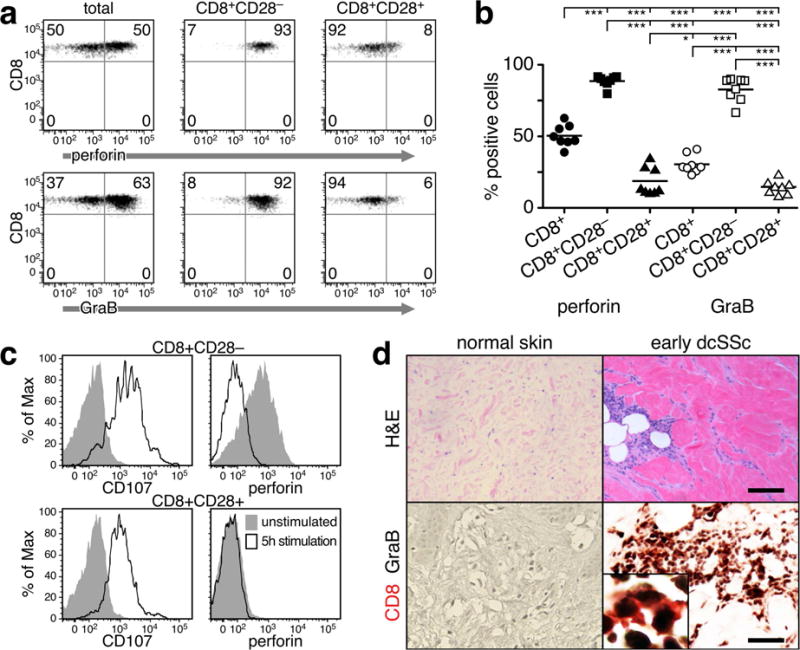
Figure 3. SSc CD8+CD28− T cells in blood and skin express markers of cytotoxicity.

(a) Perforin and GraB expression in total CD8+ and CD8+CD28+/− circulating T cells in a representative SSc patient. (b) Frequency of cells expressing perforin and GraB in each CD8 subset from 8 SSc patients. Each symbol represents one patient or a control. Statistics by ANOVA and post-hoc Tukey’s test. (c) Surface expression of CD107a and intracellular content of perforin were analyzed by flow cytometry in stimulated and unstimulated SSc CD8+CD28+/− T cells. A representative example is shown. (d) Expression of GraB by CD8+ T cells in the affected skin of patients with early dcSSc. Representative examples of H&E staining of NS and SSc skin (upper panel – scale bar = 40μm). Double-color immunohistochemistry for CD8 (red) and GraB (black) in normal (NS, n=4) and SSc skin (n=5), (200×, Inset 500×) (lower panel – scale bar = 20μm). A representative example is shown.
