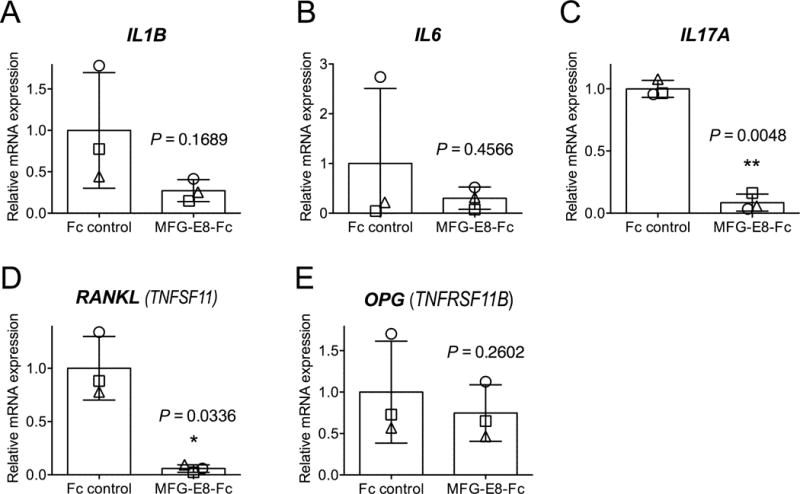
Figure 3. Effect of MFG-E8-Fc treatment on cytokine expression in the NHP periodontal tissue.

Dissected gingiva were processed for real-time PCR to determine mRNA expression of the indicated cytokines. Results were normalized to those of GAPDH mRNA and were presented as fold change relative to the mRNA transcript levels of the Fc control group, which were assigned an average value of 1. The bar graphs indicate the means ± SD (n = 3 animals, each of which is represented with a distinct symbol). *P < 0.05; **P < 0.01 versus Fc control (paired t test).
