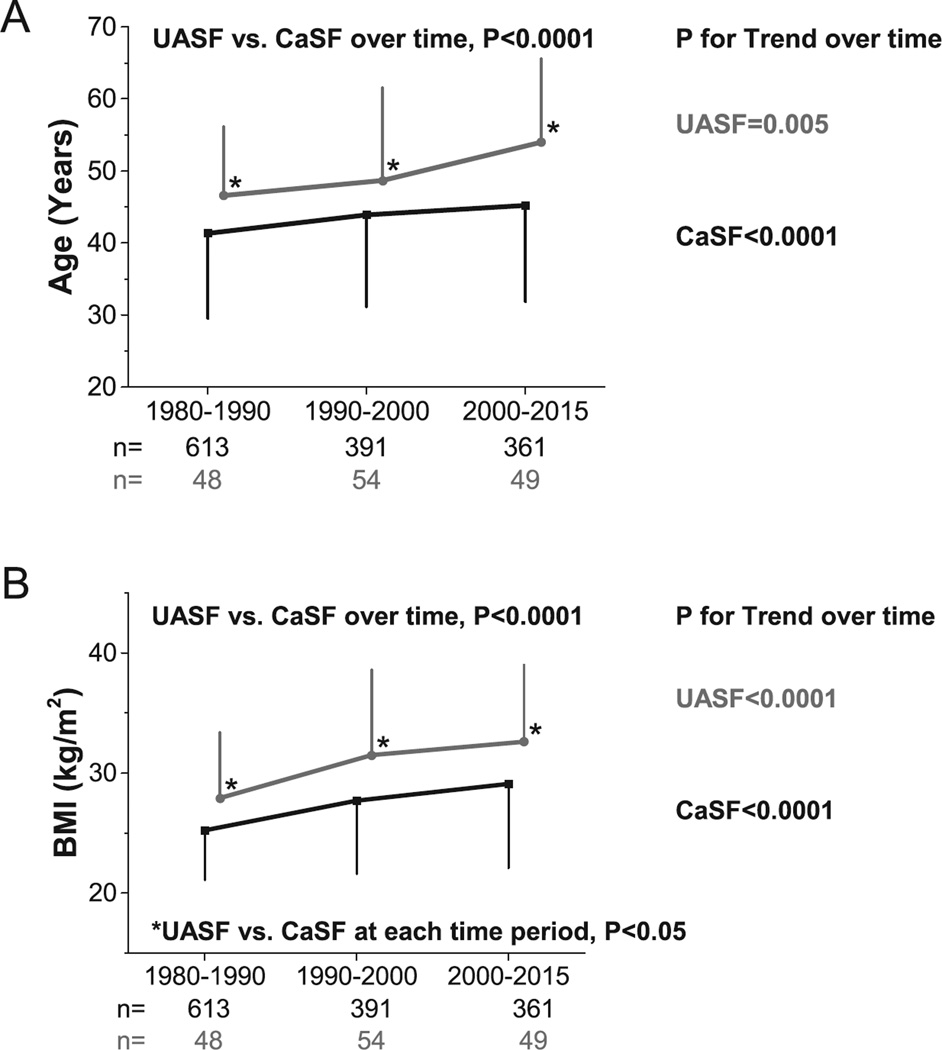
Figure 2.
A) Age trends of UASF/CaSF at different time periods; B) BMI trends of UASF/CaSF at different time periods. P-value at the top of each figure compares UASF vs. CaSF group effect, while p-values to the right of each line corresponds to test for linear trend across time periods within each group. Asterisk (*) indicates p<0.05 between for CaSF vs. UASF at corresponding time period.

