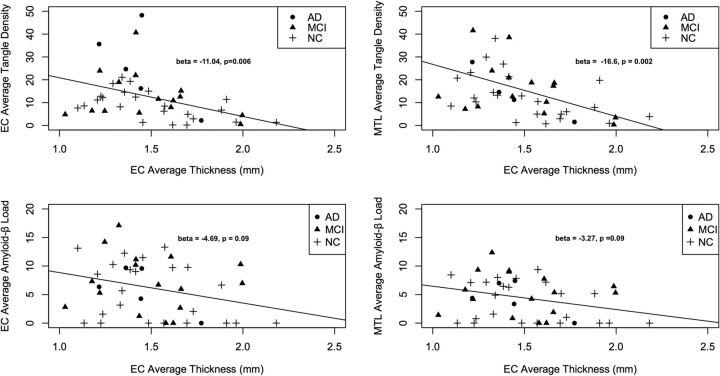
Fig 2.
Scatterplots illustrating the relationship between average entorhinal cortex thickness and average tangle density within the entorhinal cortex (upper left) and medial temporal lobe (MTL, upper right), and average amyloid-β load within the EC (lower left) and medial temporal lobe (lower right). Best-fit regression line, β-coefficients, and P values from the logistic regression model are included (for additional details see the text).

