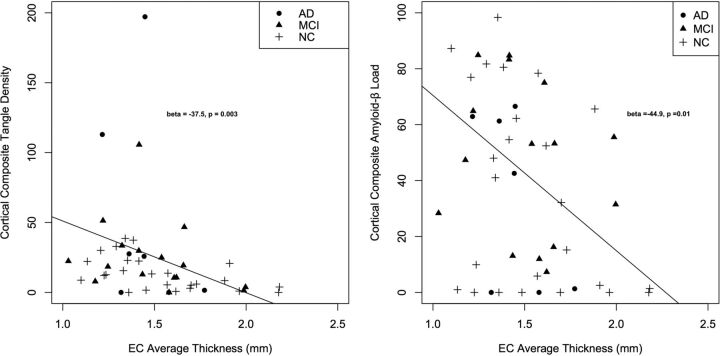
Fig 3.
Scatterplots illustrating the relationship between average entorhinal cortex thickness and composite tangle density (left) and amyloid-β load (right) within the cerebral cortex (see text for details). Best-fit regression line, β-coefficients, and P values from the logistic regression model are included (for additional details see the text).

