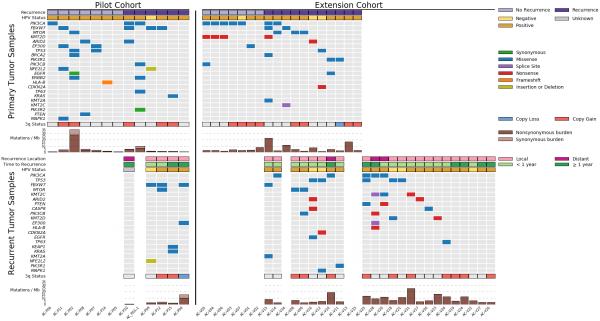
Figure 1. Overview of the mutational landscape of primary and recurrent ASCC.
Clinical characteristics, mutation and copy number data, and overall mutational burden are shown for the pilot cohort (left) and extension cohort (right). Primary tumors from each cohort are shown in the top half of the figure, and within each cohort, patients who were free from recurrence during follow-up are on the left (light purple) and patients who developed recurrent disease are on the right (dark purple). In the bottom half of the figure, similar data is displayed for recurrent tumors. Cases with both primary and recurrent tumors are vertically aligned. Copy number status for chromosome 3q is shown for ≥2-fold gain (red) and ≥2-fold loss (blue). Mutation burden is displayed as mutations/megabase (Mb). Recurrence location is annotated as local (defined as the primary tumor site or a pelvic/inguinal lymph node) or distant, and time to recurrence refers to the time interval between completion of chemoradiotherapy and biopsy-confirmed recurrent disease.

