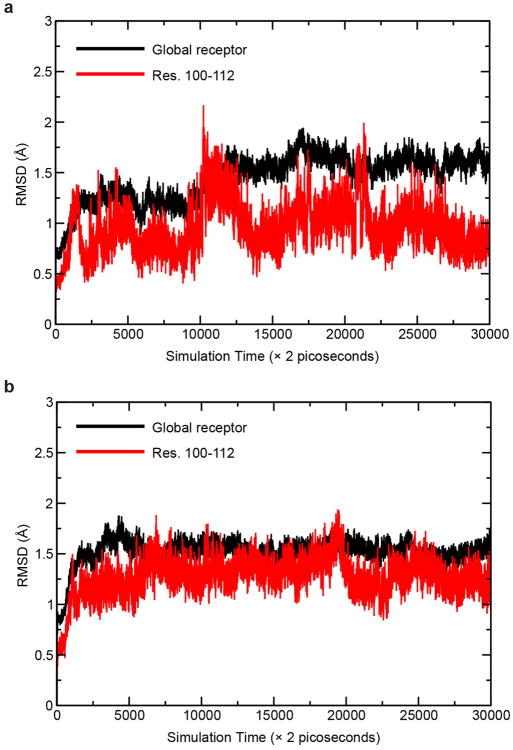
Extended Data Figure 7. Molecular dynamics (MD) simulation of the CB1 structure.
(a) 60 nsec MD simulation of the CB1 receptor (after removing the PGS fusion protein) with taranabant present. Black trace is for the entire receptor, red trace is for only the structured membrane-proximal N-terminal region.
(b) 60 nsec MD simulation of the CB1 receptor without a ligand present.Black trace is for the entire receptor, red trace is for only the structured membrane-proximal N-terminal region.

