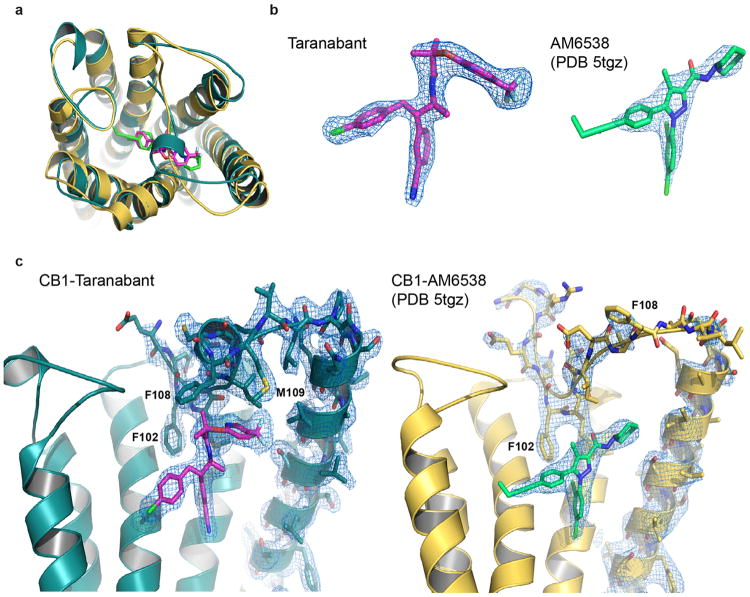
Extended Data Figure 9. Comparison of the structures of CB1 bound to taranabant and CB1 bound to AM6538 (ref. 34, PDB 5tgz).
(a) Superposition of the two CB1 structures viewed from the extracellular space. The taranabant-bound structure is shown as a teal cartoon (ligand as magenta sticks), while the AM6538-bound structure is shown as a gold cartoon (ligand as green sticks).
(b) Comparison of 2Fo-Fc electron density (contoured at 1.5 σ) for the ligands in each structure. At left is taranabant from the current structure, at right is AM6538 from ref. 34.
(c) Comparison of the membrane-proximal N-terminal regions in each structure. At left is a side view of CB1 from the current structure, with 2Fo-Fc electron density (contoured at 1.0 σ) shown for the N-terminal region, TM1, and taranabant. At right is the analogous side view of CB1 from ref. 34 (gold cartoon), with 2Fo-Fc electron density (contoured at 1.0 σ) shown for the N-terminal region, TM1, and AM6538.

