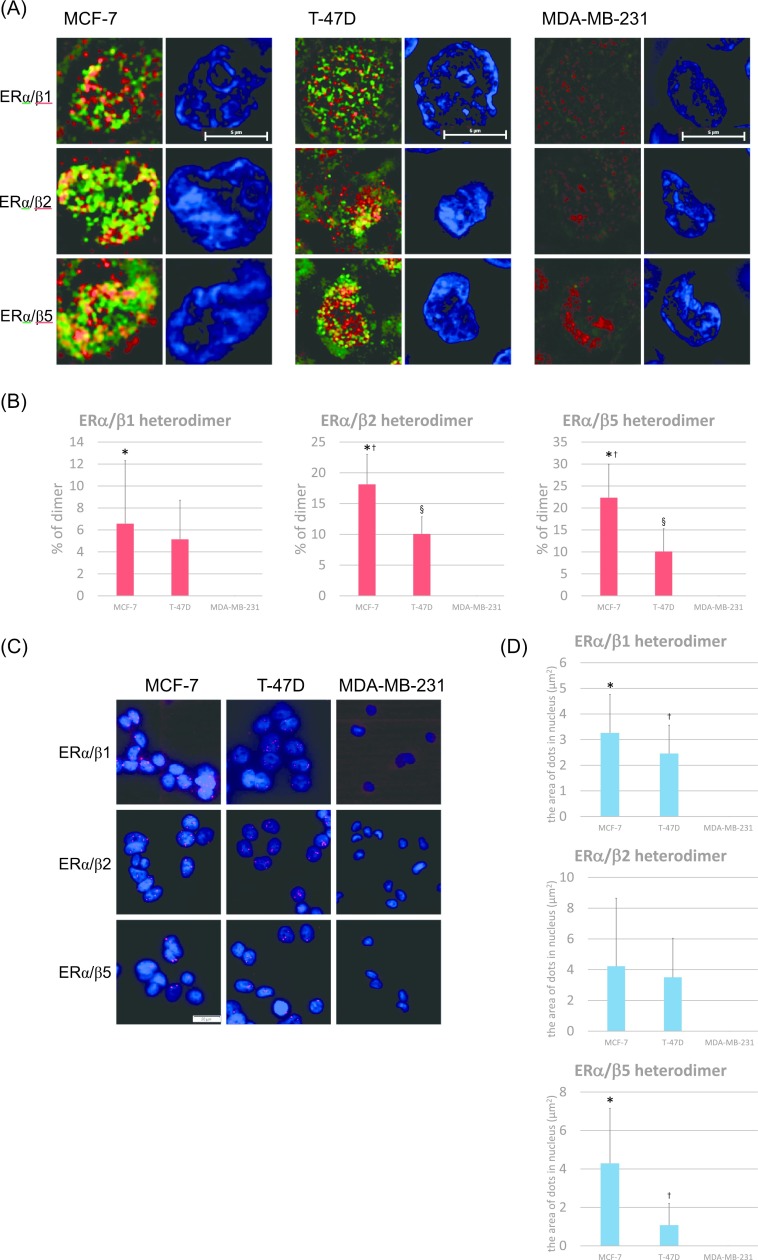
Fig. 3.
Expression of ERα/β heterodimers in breast carcinoma cells. (A) Detection of ERα/β heterodimers using N-SIM in breast carcinoma cells. Cells were double-stained for anti-ERα antibody (Alexa Fluor 488: green) and anti-ERβ antibody (Alexa Fluor 488: green). Heterodimers were represented by the yellow areas, and nuclei stained blue (DAPI). Bar = 5 μm. (B) The ratios of ERα/β heterodimers were quantified as the yellow areas in the nuclei using Lumina Vision. *p = 0.0206 vs. MDA-MB-231 for the ERα/β1 heterodimer; *p < 0.0001 vs. MDA-MB-231, †p = 0.0020 vs. T-47D, §p = 0.0004 vs. MDA-MB-231 for the ERα/β2 heterodimer; *p < 0.0001 vs. MDA-MB-231, †p = 0.0034 vs. T-47D, §p = 0.0109 vs. MDA-MB-231 for the ERα/β5 heterodimer. (C) Detection of ERα/β heterodimers using PLA. Heterodimers were represented by the red dots (Texas red), and nuclei labeled blue (DAPI). Bar = 50 μm. (D) The number of ERα/β heterodimers was quantified as the area of the dots in the nuclei using Lumina Vision. *p = 0.0011 vs. MDA-MB-231, †p = 0.0039 vs. MDA-MB-231 for the ERα/β1 heterodimer; *p = 0.0051 vs. MDA-MB-231, †p = 0.0337 vs. T-47D for the ERα/β5 heterodimer.

