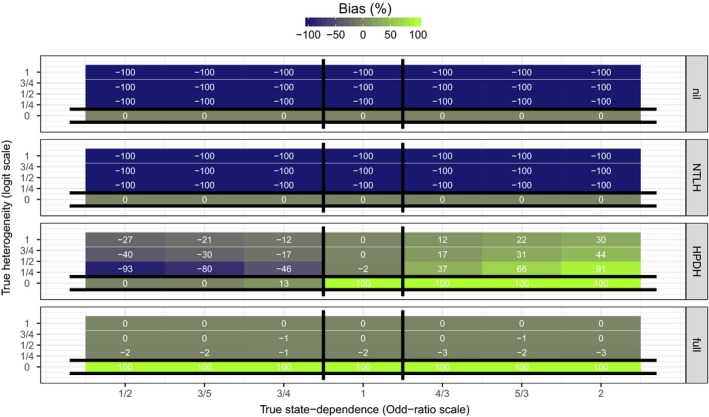
Figure 4.

Tile‐plots of the average bias in estimated HPDH (across 500 simulated datasets) for each simulation scenario. True values of state dependence (e γ on the Odds‐Ratio scale) and HPDH (σ repro) are on the x− and y− axes, respectively. Each panel corresponds to one of the four models used to analyze data. Vertical black lines bracket scenarios in which is the true data‐generating mechanism. Horizontal black lines bracket scenarios in which is the true data‐generating mechanism. Because excludes σ repro, estimates () are by definition exactly 0. At the intersection, is the true data‐generating mechanism. Everywhere else, is the true data‐generating mechanism. Estimates from the true data‐generating model should have no bias on average. Actual bias values (rounded to the nearest integer) are displayed on each tile. Biases larger than 100% in magnitude were capped at 100%
