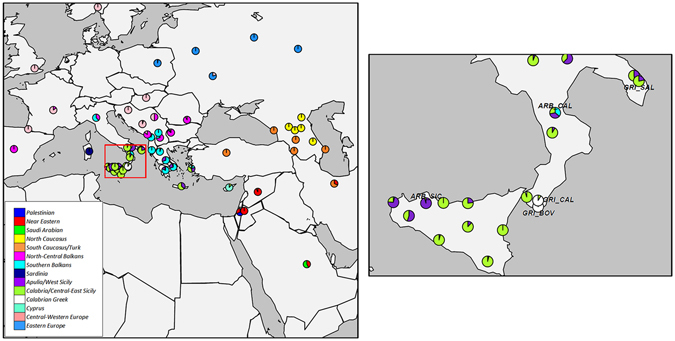
Figure 3.

Clustering of the 1,366 modern Euro-Mediterranean individuals into 14 genetic-based clusters as inferred by ChromoPainter/fineSTRUCTURE analysis. At the considered hierarchical level of K = 14, each cluster has at least 10 members. For each of the analysed populations, the relative proportions of inferred genetic clusters are summarized by corresponding pie charts. Cluster names are detailed in the legend at the bottom-left of the plot. The geographical map has been plotted using the R software [v.3.2.4] (R: A Language and Environment for Statistical Computing, R Core Team, R Foundation for Statistical Computing, Vienna, Austria (2016) https://www.R-project.org).
