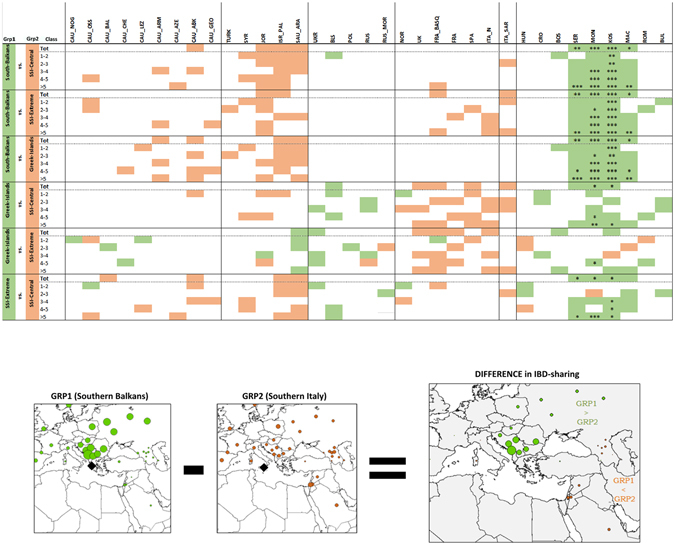
Figure 4.

Differences in IBD-sharing between Southern Italian and Southern Balkan population groups. Vectors of IBD-sharing with the 35 comparison populations reported on the x-axis were pairwise subtracted between pairs of Southern Balkan and/or Southern Italian population groups. The plots at the bottom of the figure provide a schematic representation of the pairwise-subtracting procedure (left: IBD-sharing of a Southern Balkan group with all comparison populations; centre: IBD-sharing of a Southern Italian group with all comparison populations; right: difference in IBD-sharing between the two considered groups). Comparison populations for which we observed differences in IBD-sharing between the two tested groups exceeding the lower (0.10 percentile) or the upper (0.90 percentile) bounds of the distribution are marked by coloured boxes in the table (green: Grp1 > Grp2, red Grp2 > Grp1). Significant differences in IBD-sharing, after the grubbs.test for significance (R software package outliers [v. 0.14] Komsta, L. Outliers: Tests for outliers. R package version 0.14. URL: https://CRAN.R-project.org/package=outliers (2011)), are indicated by corresponding p-values (* P-value < 0.05, **P-value < 0.01, ***P-value < 0.001). Southern Italian and Southern Balkan compared population groups were considered as follow: SSI-Extreme (Apulia-LE, Basilicata-MT and the westernmost province of Sicily-TP); SSI-Central (including the remaining populations of Central-Eastern Sicily and Calabria); Mediterranean Greek-speaking islands (Crete, Cyprus and Anatolian/Dodecanese Greece); Continental Southern Balkan populations (Albania, North-Central Greece and Peloponnesus). The geographical map has been plotted using the R software [v.3.2.4] (R: A Language and Environment for Statistical Computing, R Core Team, R Foundation for Statistical Computing, Vienna, Austria (2016) https://www.R-project.org).
