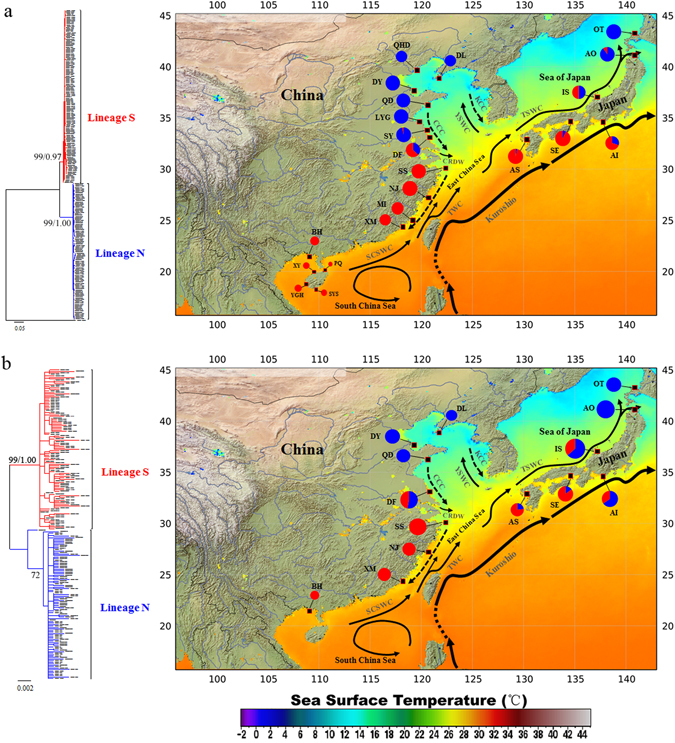
Figure 1.

Sample locations and relative frequency of two genetic lineages inferred from mtDNA COI (a) and nrDNA ITS (b). For each dataset, the corresponding maximum-likelihood (ML) and Bayesian inference (BI) trees are also presented. Numbers above branches represent maximum likelihood bootstrap (left) and Bayesian posterior probabilities (right) for the two major lineages. The map also presented Sea Surface Temperature (SST) in the NW Pacific in winter (2002–2011), which was modified from ref. 78. SCSWC, South China Sea Warm Current; TWC, Taiwan Warm Current; CCC, China Coastal Current; CRDW, Changjiang River Diluted Water; YSWC, Yellow Sea Warm Current; TSWC, Tsushima Warm Current.
