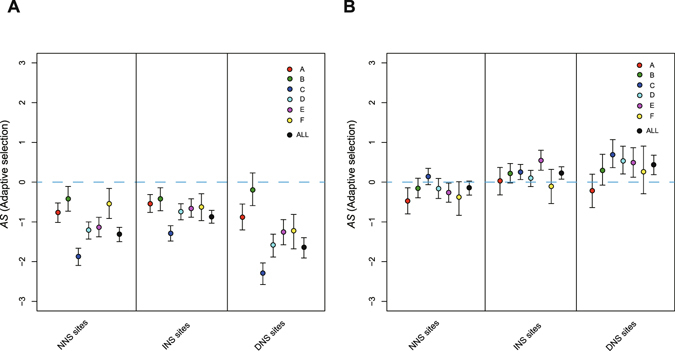
Figure 3.

Adaptive evolution of non-synonymous variants in HBV. (A–B) Plots of AS statistics of NNS, INS and DNS variants. The calculation was performed using (A) low frequency and (B) high frequency variants separately. Low frequency variants were defined by <1% DAF or singletons. AS was first computed based on polymorphic variants in each genotype separately and then all polymorphic variants were combined (dot in black). Genotypes G and H are not showed because of small sample size (Supplementary Tables S4 and S5). Error bars denotes the 90% confidence intervals derived from bootstrapping tests of 1000 times for AS. Blue dashed line denotes the neutral index, where AS = 0.
