Figure 2.

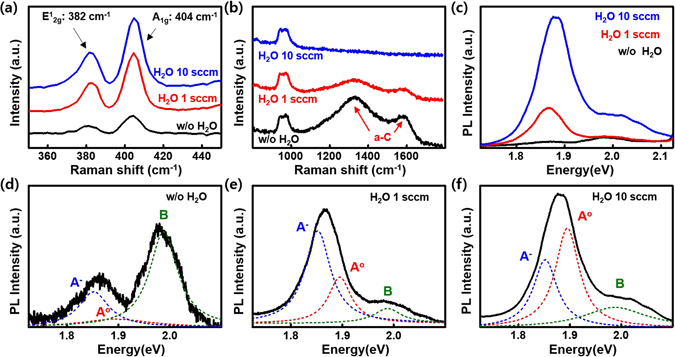
Effect of water supply I: the removal of a-C. (a,b) Raman and (c) PL spectra of MoS2 specimens with/without water supply (black: without (w/o) water, red: H2O 1 sccm, and blue: H2O 10 sccm, respectively). Each Raman spectrum for (a) and (b) display the presence of MoS2 and a-C, respectively. (d,e) Deconvoluted PL spectra of (d) w/o water, (e) H2O 1 sccm, and (f) H2O 10 sccm water with Lorentzian curves at 1.852 eV (blue, multiexciton, A−), 1.895 eV (red, neutral exciton, A°), and 1.988 eV (green, neutral exciton, B), respectively.
