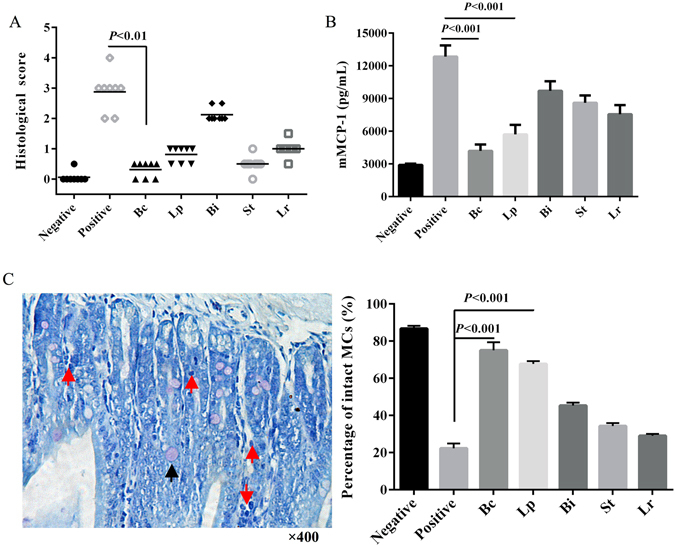
Figure 3.

Histological and mast cell analyses of intestinal tissues after administration of different LAB strains during response to ST sensitization. (A) histological scores; (B) serum concentration of mouse mast cell protease-1 (mMCP-1); (C) representative intestinal specimens stained with toluidine blue (TB), and the percentage of intact mast cells (MCs) in lamina propria. Sections were photographed at ×400 magnifications using a light microscope. Intact and degranulated MCs are indicated by black and red arrows, respectively. The error bars indicate standard deviation (±SD).
