
Figure 2.
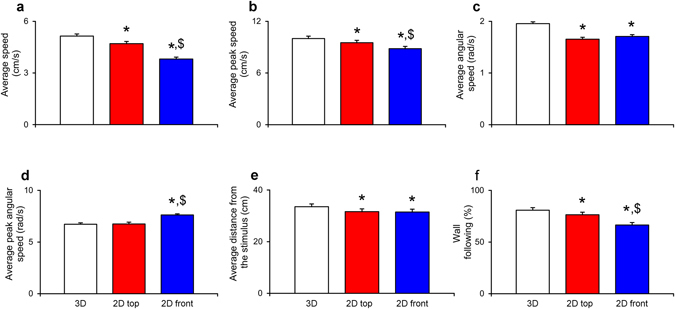
Comparison between 3D reconstructed trajectories and 2D top and front views. Group values of average speed, average peak speed, average angular speed, average peak angular speed, wall following, and average distance from the stimulus depending on the scoring method: “3D” represents the 3D reconstructed data, “2D top” represents 2D data acquired from the top camera, and “2D front” represents 2D data acquired from the front camera. Data were analyzed through repeated measures ANOVA for split-plot designs with condition as between-subject factor and scoring method as within-subject factor. Post-hoc comparisons were performed using Tukey’s HSD with a significance level of 0.05: * Identifies significant differences in comparisons with 3D measurements and $ identifies significant differences with 2D top views. Data are expressed as mean + standard errors. (a) Average speed values varied with the scoring method (n = 90; F2,168 = 247.434, p < 0.001): 3D view yielded higher values compared to 2D top and front views; furthermore, 2D top view values were higher than 2D front view values. (b) Average peak speed values varied with the scoring method (n = 90; F2,168 = 26.118, p < 0.001): 3D view yielded higher values compared to 2D top and front views; furthermore, 2D top view values were higher than 2D front view values. (c) Average angular speed values varied with the scoring method (n = 90; F2,168 = 51.905, p < 0.001): 3D view yielded higher values compared to 2D top and front views. (d) Average peak angular speed values varied with the scoring method (n = 90; F2,168 = 44.160, p < 0.001): 2D front view yielded higher values compared to 3D and 2D top views. (e) Values of average distance from the stimulus varied with the scoring method (n = 80; F2,150 = 127.409, p < 0.001): 3D view yielded higher values compared to 2D top and front views. (f) Time spent following the walls of the tank varied with the scoring method (n = 90; F2,168 = 71.531, p < 0.001): 3D view yielded higher values compared to 2D top and front views; furthermore, 2D top view values were higher than 2D front view values.