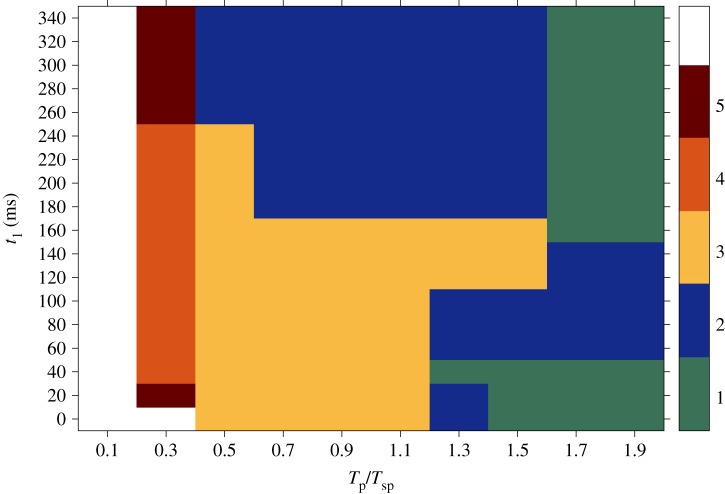
Figure 9.
Results obtained from simulations in the anisotropic case during an asymptotic regime. On the x-axis different time intervals between pulses (Tp) relative to the period of the spiral (Tsp) are shown, varying from overdrive to underdrive pacing. The y-axis reports several initial conditions at which the first pulse was delivered (t1), each one corresponding to a specific position of the spiral on the border of the heterogeneity within one rotation period (cf. figure 8). The maximum number of stimulations delivered during the pacing protocol was five, so the white area in the graph corresponds to sequences that were not successful within the five pulses. For this reason, no statement can be made about the possibility of terminating the spiral wave in that region. (Online version in colour.)

