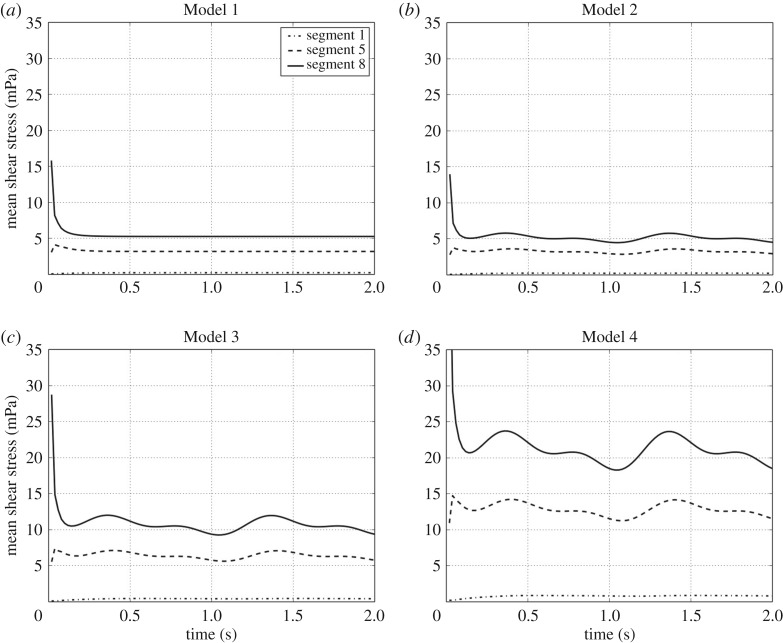
Figure 6.
Mean shear stress time evolution per segment (in mPa). (a–d) The periodic behaviour of the mean shear stress on the wall holes of some drainage segments corresponding to Models 1–4, respectively. For the sake of a better visualization, only the time evolution of the shear stress on the segments 1, 5 and 8 is shown; the shear stress evolution behaviour in the other segments is similar.

