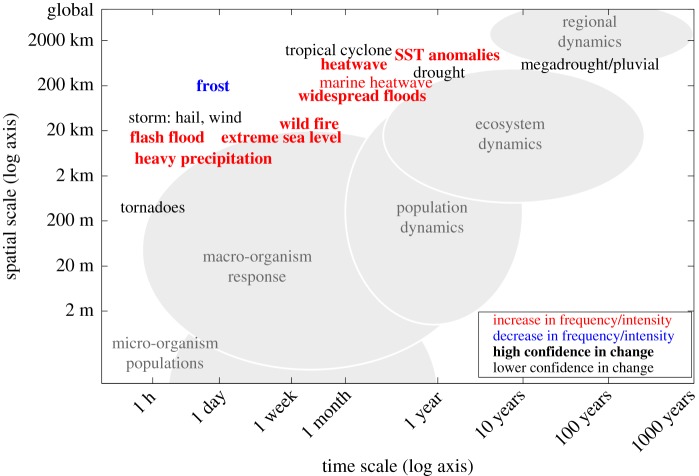
Figure 2.
Spatial and temporal scales of typical ECEs and scales of biological systems (shaded grey). Individuals, populations and ecosystems within these respond to environmental stressors. Red (blue) labels indicate an increase (decrease) in the frequency or intensity of the event, with bold font reflecting confidence in the change. For each ECE type indicated in the figure, ECEs are likely to affect biological systems at all temporal and spatial scales located to the left and below the specific ECE position in the figure (modified from Leonard et al. [159] and Sheehan [160]).

