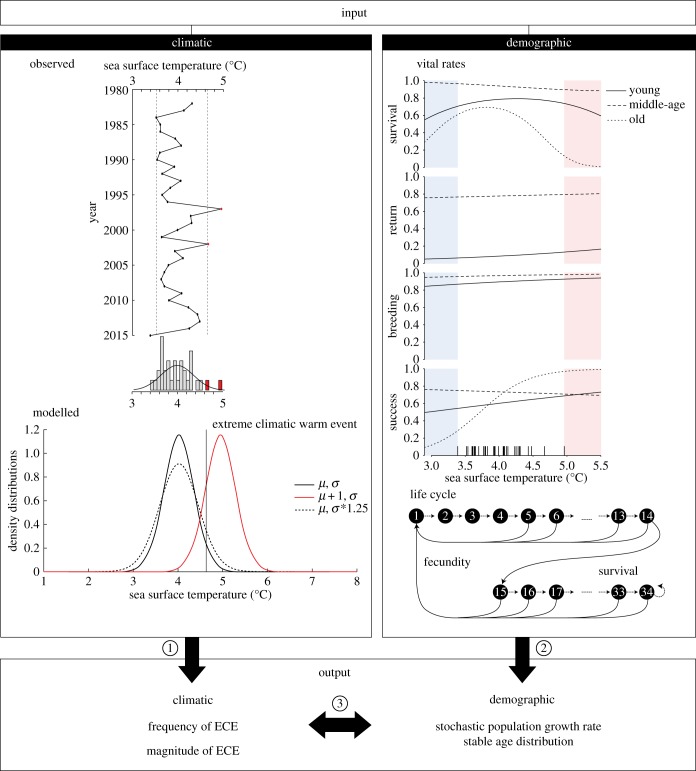
Figure 1.
Sketch explaining the approach followed in this paper. Input environmental data consist of SST sampled from a normal distribution (middle-left). The observed SST from 1982 to 2015 was used to determine a threshold of warm ECE (top-left in red). We defined the ECE frequency as the occurrence of ECE, and the ECE magnitude as the maximum SST values occurring in the simulated environment. The population model projects the number of individuals within each age-class and is described by an age-structured life cycle (middle-right) where vital rates depend on both age and SST (top-right). Vertical traits on the x-axis represent the occurrence of historical SST. The outputs are of two kinds (bottom): climatic, to measure the influence of SST distribution parameters on the frequency and magnitude of warm SST ECE (1), and demographic, to measure the influence of SST distribution parameters on the stochastic population growth rate and on the stable age distribution (2). The two outputs were also combined (3).

