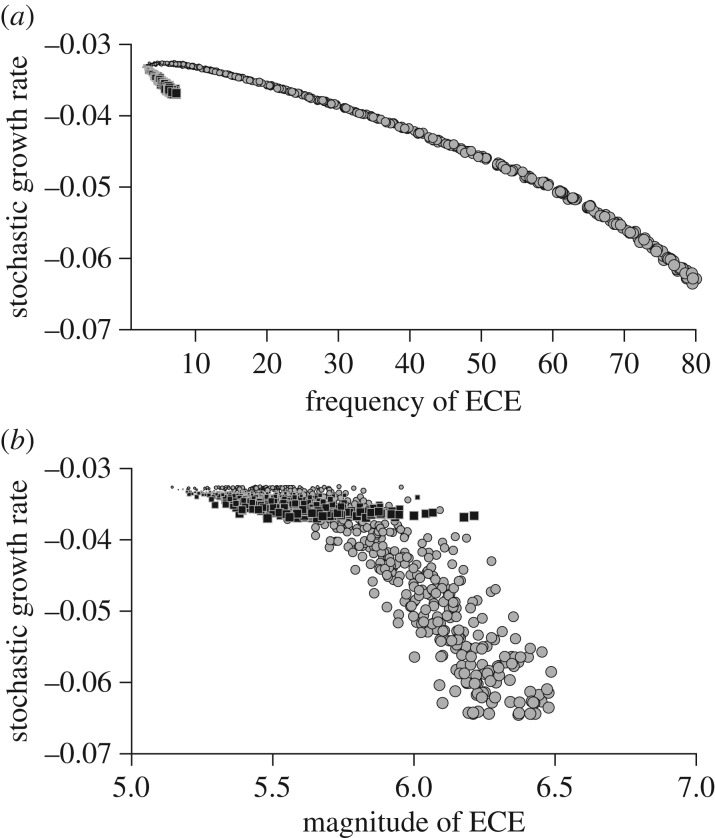
Figure 6.
Relationships between the stochastic population growth rate log(λs) and frequency (a) and magnitude (b) of warm SST ECE according to changes of the two parameters of a normal distribution (mean (μ) increasing up to 1°C, grey circles; and standard deviation (σ) multiplied by up to 1.25, black squares; see also the electronic supplementary material, C).

