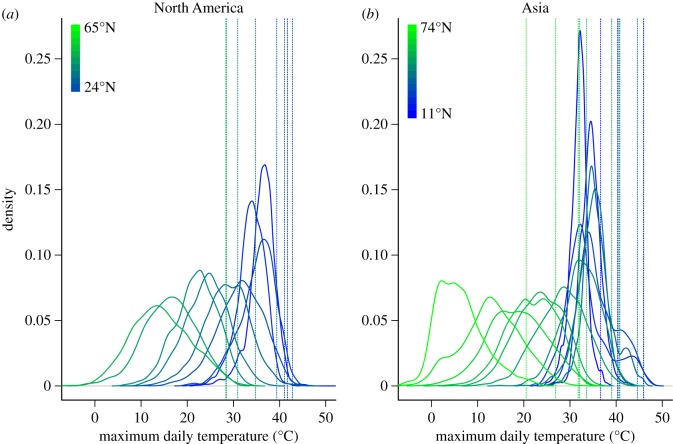
Figure 1.
The distribution (and 99% quantiles: dashed vertical lines) of maximum daily temperature (°C) broadens and shifts toward lower temperatures as the latitudes of weather stations increase along latitudinal gradients (at 5° intervals) in the centres of (a) North America (−100 °E) and (b) Asia (77.5 °E).

