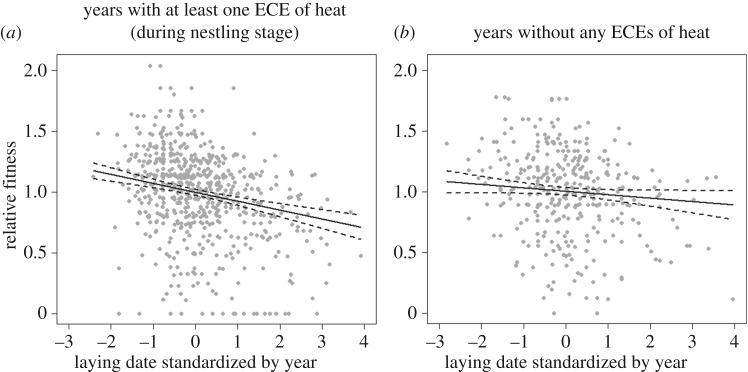
Figure 1.
Directional selection gradient for laying date (solid lines) estimated on a dataset containing only years that did (a) or did not (b) experience at least one extremely hot day during the nestling period. The datasets (a) and (b) included 14 (n = 843) and 11 (n = 543 broods) years, respectively. Dashed curves represent 95% CIs. See detailed estimates in table 4.

