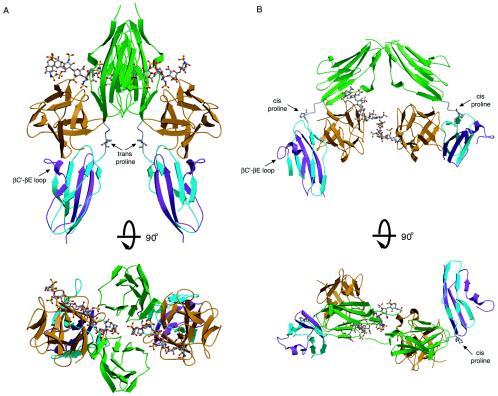
FIG. 1.
Two competing models for FGFR dimerization. (A) Ribbon diagram of the FGF2-FGFR1c-heparin crystal structure (PDB ID, 1FQ9) in two views related by a 90° rotation about the horizontal axis. The distance between the membrane insertion points at the end of D3 is 48 Å in the symmetric two-end model. FGF ligand and D2 are colored orange and green, respectively. The first half of D3 is colored blue, and the alternatively spliced region of D3 is colored purple. Atom coloring for heparin is as follows: oxygens red, sulfurs yellow, nitrogens blue, and carbons gray. (B) Ribbon diagram of the FGF1-FGFR2c-heparin crystal structure (PDB ID, 1E0O). Note that in the asymmetric model, heparin interacts with only the FGFR in the left half of the dimer. The distance between the membrane insertion points at the end of D3 is 74 Å in this model. Coloring is as in panel A. The location of the βC′-βE specificity loop in each model is indicated by an arrow. The location and isomerization state of the D2-D3 linker invariant proline are indicated for each structure.

