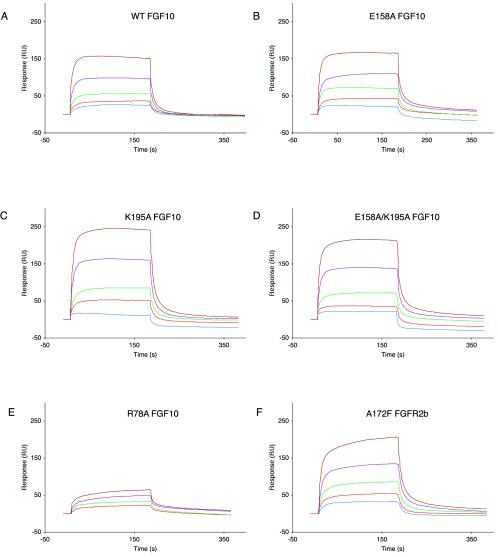
FIG. 4.
Surface plasmon resonance analysis of wild-type (WT) and mutant FGF10-FGFR2b interactions. Sensorgrams of FGFR2b binding to (A) wild-type FGF10, (B) E158A FGF10, (C) K195A FGF10, (D) E158A-K195A FGF10, and (E) R78A FGF10 are shown. In panel F, a sensorgram of A172F FGFR2b binding to wild-type FGF10 is shown. Analyte concentrations are colored as follows: 50 nM, blue; 100 nM, red; 200 nM, green; 400 nM, violet; and 800 nM, brown. Kinetic data are summarized in Table 1. RU, response units.

