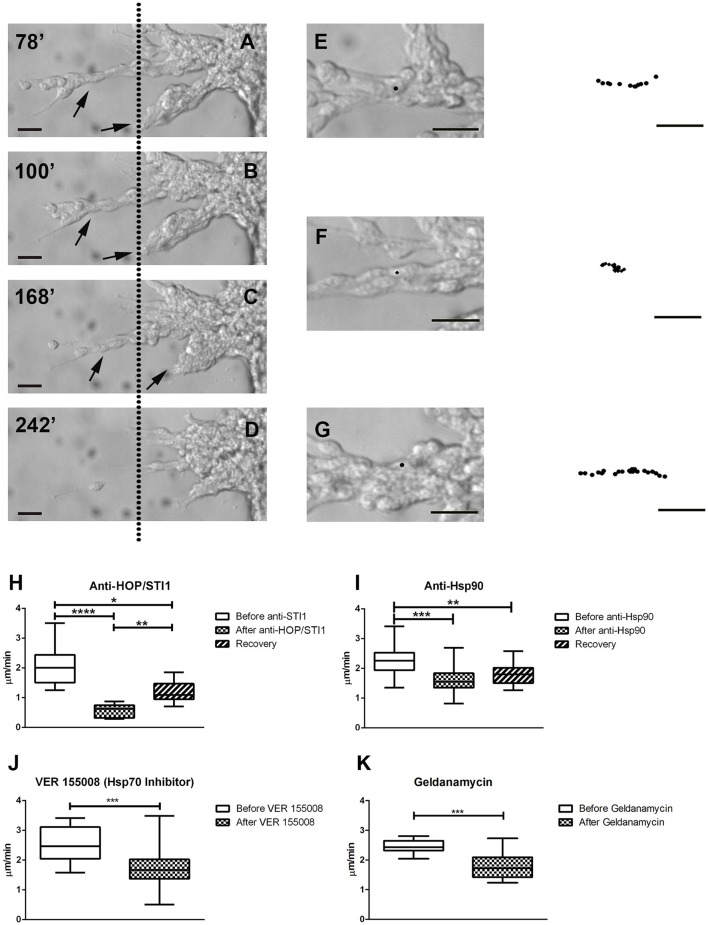
Figure 4.
Time-lapse videomicroscopy demonstrates collapse of migratory chains and decrease in average cell migratory speed. In A–D, after anti-HOP/STI1 treatment, individual cells within chains are nearly indistinguishable, as the cells cluster into compact masses in the proximity of explants. Simultaneously, chains (arrows) start to collapse back to the explants. These responses were registered during the course of 164 min. Dotted line is used as a visual reference. The minutes indicate the time elapsed after the onset of the recording (A:78, B:100, C:168, and D:242 min). Individual cells were tracked before (E), during (F) and after (G) anti-HOP/STI1 treatment, as can be seen in the bright-field images. The column in the far right depicts the cell trajectory during a given period of time (E, 24, F, 52, and G, 46 min) demonstrating that cell movement is inhibited in the presence of the antibody. Average cell speed is reduced in a significant manner after antibody treatment, as can be seen both with anti-HOP/STI1 (H, One way Anova, p < 0.0001) and anti-Hsp90 (I, One way Anova, p < 0.001), however this effect is only reversed after removal of anti-HOP/STI1 of the culture media (Anti-HOP/STI1, after anti-HOP/STI1 vs. recovery p < 0.01; Anti-Hsp90, after anti-Hsp90 vs. recovery, n.s.). A similar result was observed after exposure to VER155008 and Geldanamycin, Hsp70 and Hsp90 inhibitors, respectively (J, VER155008 unpaired t-test, p < 0.001; K, Geldanamycin unpaired t-test, p < 0.01) Scale bars: (A–D) 20 μm, (E–G) 20 μm. Tukey's multiple comparison test was used as post-hoc test after One way Anova analysis. *p < 0.05, **p < 0.01, ***p < 0.001, ****p < 0.0001.

