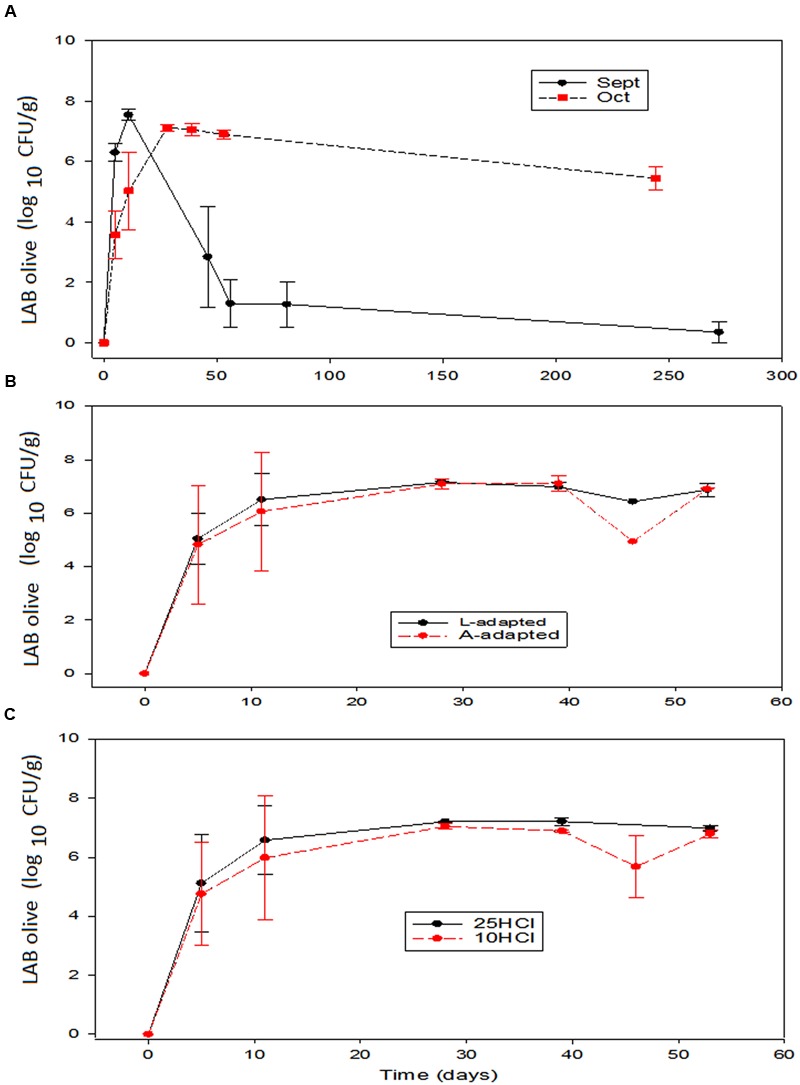
FIGURE 5.

Application of potential probiotic starter (LAB2) at industrial scale (season 2012/2013). Changes in LAB on olives (± CL, n = 4 for each level) according to time season (A), type of inoculum (B), and proportion of HCl added to fermentation vessels (C). The values are always averages over the other two non-included in the graph variables. See Figure 1 for the meanings of symbols.
