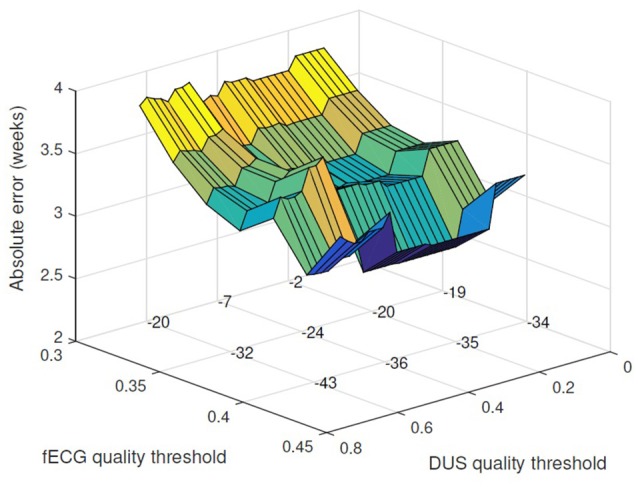
Figure 3.

Applying threshold for acceptable DUS and fECG signal quality, the absolute error for GA estimation is reduced. The absolute error (weeks) is plotted vs. the thresholds for fECG and DUS signal quality scores. The number of excluded cases for different choices of the quality thresholds are shown on the grid knots.
