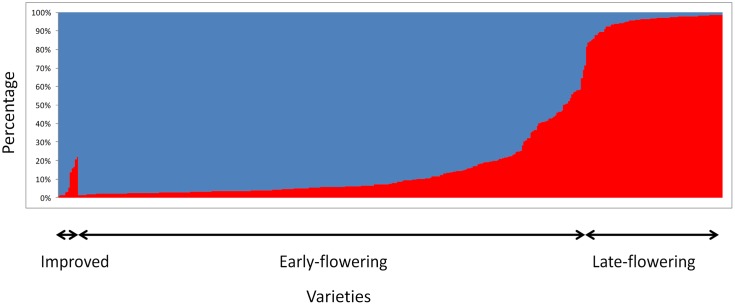
FIGURE 2.
STRUCTURE results for K = 2 based on 404 accessions analyzed with 12 SSRs. Each bar represents an individual. It shows the proportion of genome belonging to each of the two genetic groups (blue for early flowering accessions and red for late-flowering accessions) identified with STRUCTURE.

