
FIGURE 1.
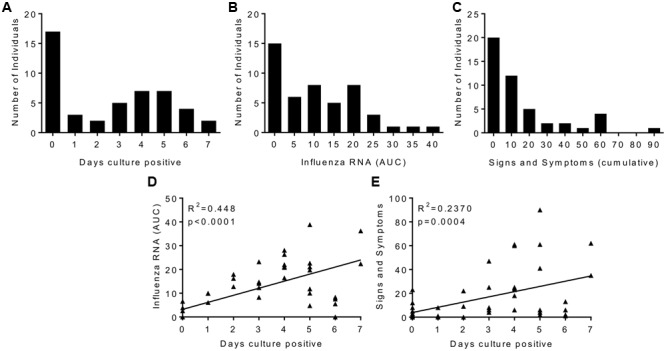
Human influenza infection in clinical volunteers. Patients were inoculated intranasally with 3.5 × 10⁶ TCID50 influenza A/California/2009 (H1N1). Samples were collected daily and assessed for influenza by culture or rtPCR, and disease signs and symptoms. Cultured virus presented as days virus positive (A), influenza RNA rtPCR data presented as area under the curve plotted over the time course of infection (B), signs and symptoms are presented as cumulative total (C). Correlation plots of days virus positive against detectable Influenza RNA (D) or signs and symptoms (E). (A–C) Are presented as binned frequencies. Data presented are combined from two studies, n = 47 volunteers.