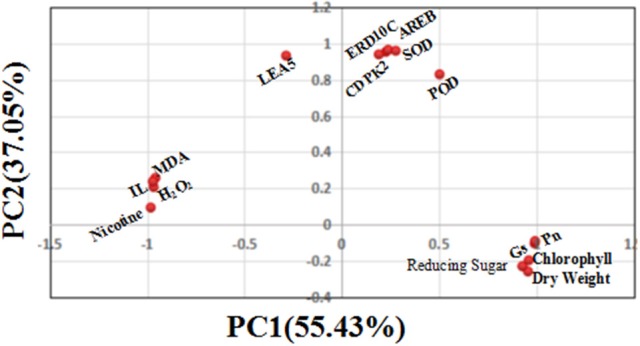
Figure 10.

Scatter plot of the top two principal components (including 15 physiological biochemical and gene transcript parameters) under drought stress. The proportion of variance for principal component analysis based on the drought stress index (DSI) of 15 physiological traits is shown in the figure, showing that PC1 and PC2 explain 92.48% of total variation.
