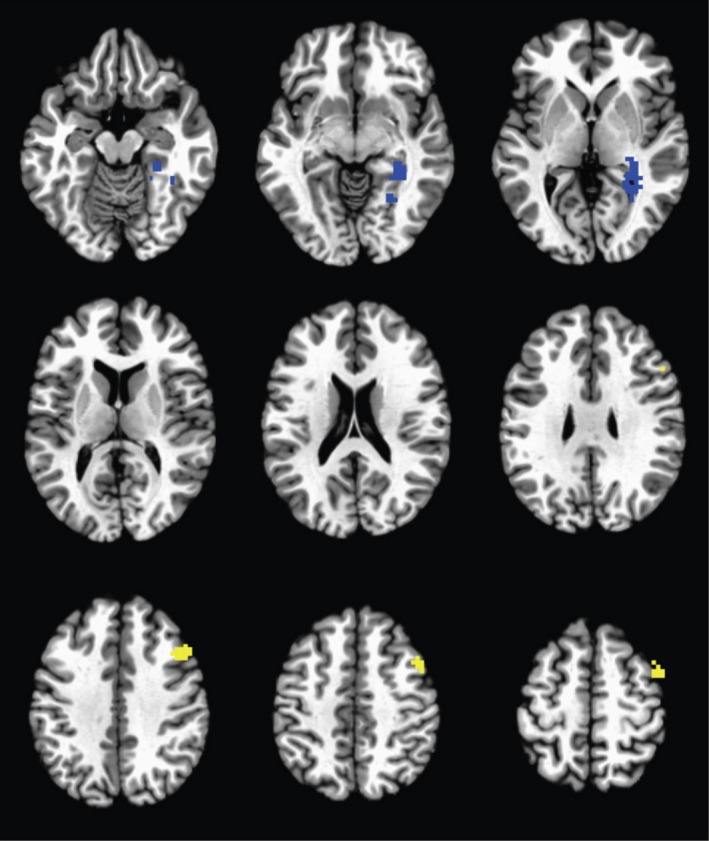
Figure 3.

Group‐level differences in functional connectivity with the bilateral amygdala seed. Images are cluster‐corrected and threshold to p < .05. The right parahippocampal gyrus demonstrated decreased functional connectivity (blue) and the right middle frontal gyrus demonstrated increased functional connectivity (yellow) in the I‐ELT + group relative to the I‐ELT − group
