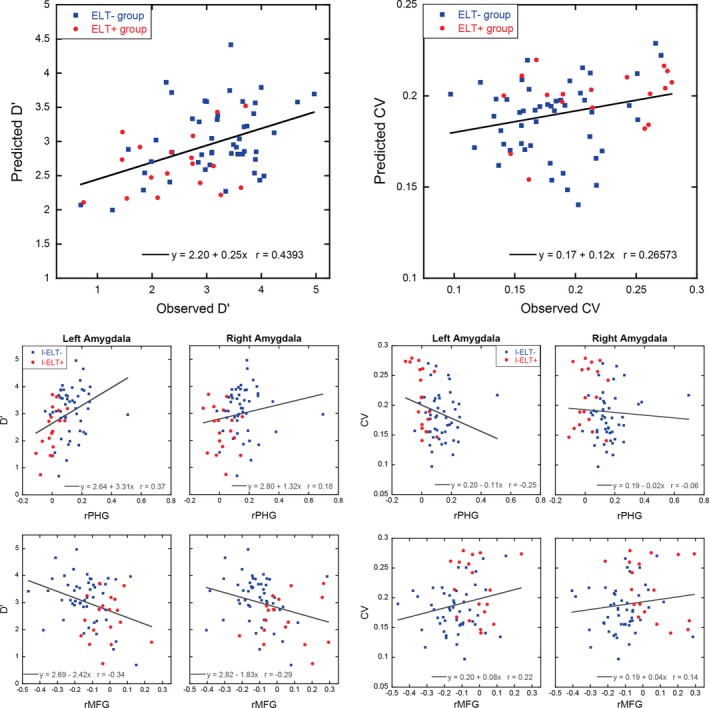
Figure 4.

Scatterplots in the two top panels showing the relationship between the observed and predicted discrimination ability (d’; left panel) and the observed and predicted reaction time variability (CV; right panel) for each participant using LOSO multiple linear regression approach with the four amygdala connectivity clusters as predictors. While the models were built without regard to I‐ELT status, for illustrative purposes I‐ELT + participants are shown as red circles while I‐ELT − participants are shown as blue squares. The bottom panels show first‐level correlations for each of the four amygdala connections used in the multiple linear regression analysis with d’ (left) and CV (right). The regression lines in these bottom panels are for illustrative purposes only, and were calculated using the entire dataset without cross‐validation
